
Operations Case Interview: Framework, Math & Example
Operations case interview guide: bottlenecks, throughput, utilization, four case types, key formulas, and a worked production case.
On this page
An operations case interview asks you to improve cost, capacity, process performance, or production. Define the required output and service level, map the relevant activities, and calculate the constraint before choosing a change. Check demand, quality, downtime, and implementation cost so that a faster stage translates into useful output for the whole business.
Which Operating Problem Are You Solving?
A narrow cost-removal task belongs with the cost-reduction guide. This page keeps the wider operating-system decision, including service and output. Use the units and time period in the prompt consistently.
What an Operations Case Interview Actually Is
An operations case is about the mechanics of the business: the factory floor, the call center queue, the warehouse pick path, the kitchen line. The question is never abstract strategy. It is concrete and physical: how many units can this system produce, where does it slow down, and what does it cost to make one more.
The cleanest way to separate operations from the other case types is the "how it runs" versus "what to do" distinction:
Profitability and operations overlap (both touch cost), but the lens differs. A profitability case decomposes profit into a revenue tree and a cost tree to find what moved. An operations case treats the business as a process with stages and asks which stage limits the whole. Use the wrong lens and you miss the bottleneck, which is the single most common failure mode.
Practice an operations case with AI feedback
Operations cases turn on finding the bottleneck and sizing the gap fast. Run one and get scored on your throughput logic, utilization math, and the lever you choose.
Which Firms Lean Hardest on Operations Cases
Operations cases show up across the industry, but some firms weight them far more heavily because their client work is implementation-focused.
- McKinsey runs a dedicated Operations practice covering manufacturing, supply chain, procurement, and service operations. An operations prompt may use a numerical exhibit; confirm your interview format with recruiting.
- BCG and Bain both use operations and process cases, frequently framed as margin or cost-improvement problems that resolve into a throughput or yield question.
- Deloitte and the other Big Four lean on operations cases because so much of their consulting revenue is operational transformation and process redesign.
- Accenture is implementation-heavy by identity, so its cases skew toward how to actually run and improve a process, not just what to recommend.
- Kearney is known specifically for operations, sourcing, and supply chain, and its cases are noticeably more quantitative than typical MBB cases.
The common thread: the more a firm sells execution, the more it tests whether you can reason through the operating mechanics of a recommendation. If you are recruiting at any of these, operations math should be in your daily drill rotation, not an afterthought.
The Four Canonical Operations Case Types
Four useful operating objectives organize the examples below. What matters for prep is mapping each type to the exact quant lever it tests, so you know which math to expect the moment you hear the prompt.
A production optimization case hands you a line with several stages and asks you to lift total output, which often requires finding and relieving a binding constraint. A process improvement case is about flow quality: where time leaks, where rework happens. A cost-cutting case pushes on cost per unit and how fixed costs spread over volume. A forecasting/capacity case asks whether the system can absorb projected demand and what happens to utilization if it cannot.
Knowing the type tells you the math before you have even structured. Hear "we can't keep up with orders" and you are in production optimization or capacity planning; reach for throughput and utilization. Hear "our margins are thinner than competitors" on a manufacturing client and you are likely in cost-cutting; reach for cost per unit and fixed-cost absorption.
Why There Is No Single Operations Framework
Start with the operating objective and the actual process. There is no clean, memorizable operations framework, because operations problems are too varied. A semiconductor fab, a hospital ER, and a pizza delivery chain share no off-the-shelf structure.
What works instead is a first-principles approach you can apply to any operating system:
First-Principles Operations Structure
- 01
1. Define the System. State the operating goal and the unit of output. Are we counting cars per day, calls resolved per hour, orders shipped per shift? Pin the metric before anything else.
- 02
2. Break into Stages. Map the process as sequential steps from input to output. Each stage has its own rate or capacity. Draw it as a flow, not a list.
- 03
3. Find the Bottleneck. Identify the stage with the lowest throughput. That single stage caps the entire system's output, no matter how fast the others run.
- 04
4. Quantify the Gap. Calculate current output vs target. Size how much the bottleneck is costing in lost units, time, or money.
- 05
5. Relieve the Constraint. Generate 2-3 specific levers to lift the bottleneck (add a shift, add a machine, cut changeover time, reduce defects), then re-check whether the bottleneck moves to the next stage.
- 06
6. Recommend with Tradeoffs. Lead with the lever, quantify the gain, and name the cost or risk. Operations recommendations must be executable, not aspirational.
This is more demanding than memorizing a template, but it is also more robust: it works on any operations case, and it signals exactly the kind of structured, tailored thinking the interviewer is grading. Note the step most candidates skip: after you relieve a bottleneck, the constraint usually moves to the next slowest stage. Saying so out loud is a strong signal.

Operations · medium
Practice operations in a real case interview
Matched to this operations guide: a live retail supply chain operations case with an AI interviewer. Free, scored on every step.
The Operations Levers and Formulas You Must Know Cold
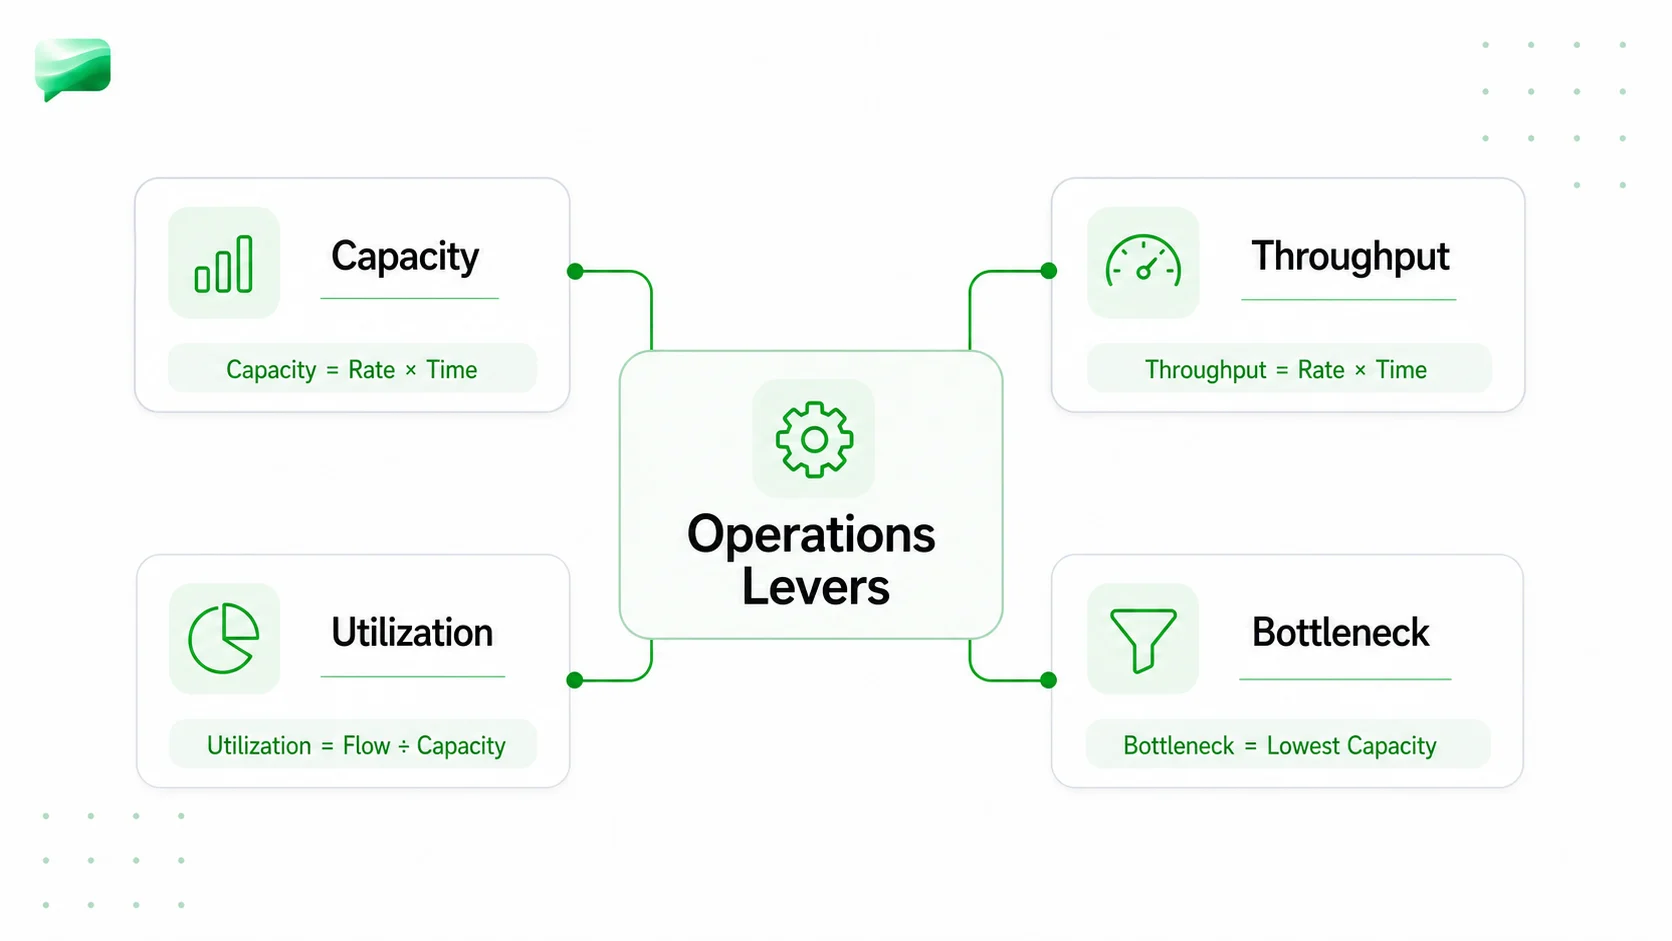
Operations cases reward instant recall of a small set of formulas. Memorize each one with a worked number, not just the formula, so the arithmetic is automatic under pressure.
Output = Rate x Time A machine runs at 50 units/hour for 8 hours. Output = 50 x 8 = 400 units. If only 7 of those hours are productive (one hour lost to setup), output = 50 x 7 = 350 units.
Utilization = Output / Maximum Output The same machine could theoretically make 400 units but actually makes 350. Utilization = 350 / 400 = 87.5%. This is utilization against nameplate capacity. If one hour is an unavoidable setup requirement, sustainable capacity is 350 and the same output uses 100% of that capacity. State the denominator before calling the gap recoverable headroom.
Throughput = units the system completes per unit of time Throughput is governed by the bottleneck stage, never the average. For a simple serial line with sufficient demand, no losses, adequate buffering, and effective stage capacities of 100, 60, and 90 units/hour, maximum sustainable throughput is 60 units/hour. Actual throughput can be lower because of demand, downtime, starvation, or quality losses.
Bottleneck = the stage with the lowest capacity Find it by comparing each stage's rate. The bottleneck is the only stage where added capacity raises total output; speeding up a non-bottleneck stage changes nothing.
Lead time = total elapsed time from input to finished output If an order spends 2 hours in processing, 5 hours waiting in a queue, and 1 hour in shipping, lead time = 8 hours, even though only 3 hours were "working." Most lead-time reduction comes from cutting wait/queue time, not speeding up the work.
People-Process-Technology segmentation When you generate levers, sort them into three buckets: People (staffing, shifts, training), Process (sequencing, batch size, changeover, layout), and Technology (automation, equipment, software). It guarantees you propose more than one type of fix.
Make throughput and utilization automatic
Operations cases move quickly once the table appears. Practice setting up calculations and checking units on fresh general math questions.
A Fully Worked Operations Case, Math Shown Line by Line
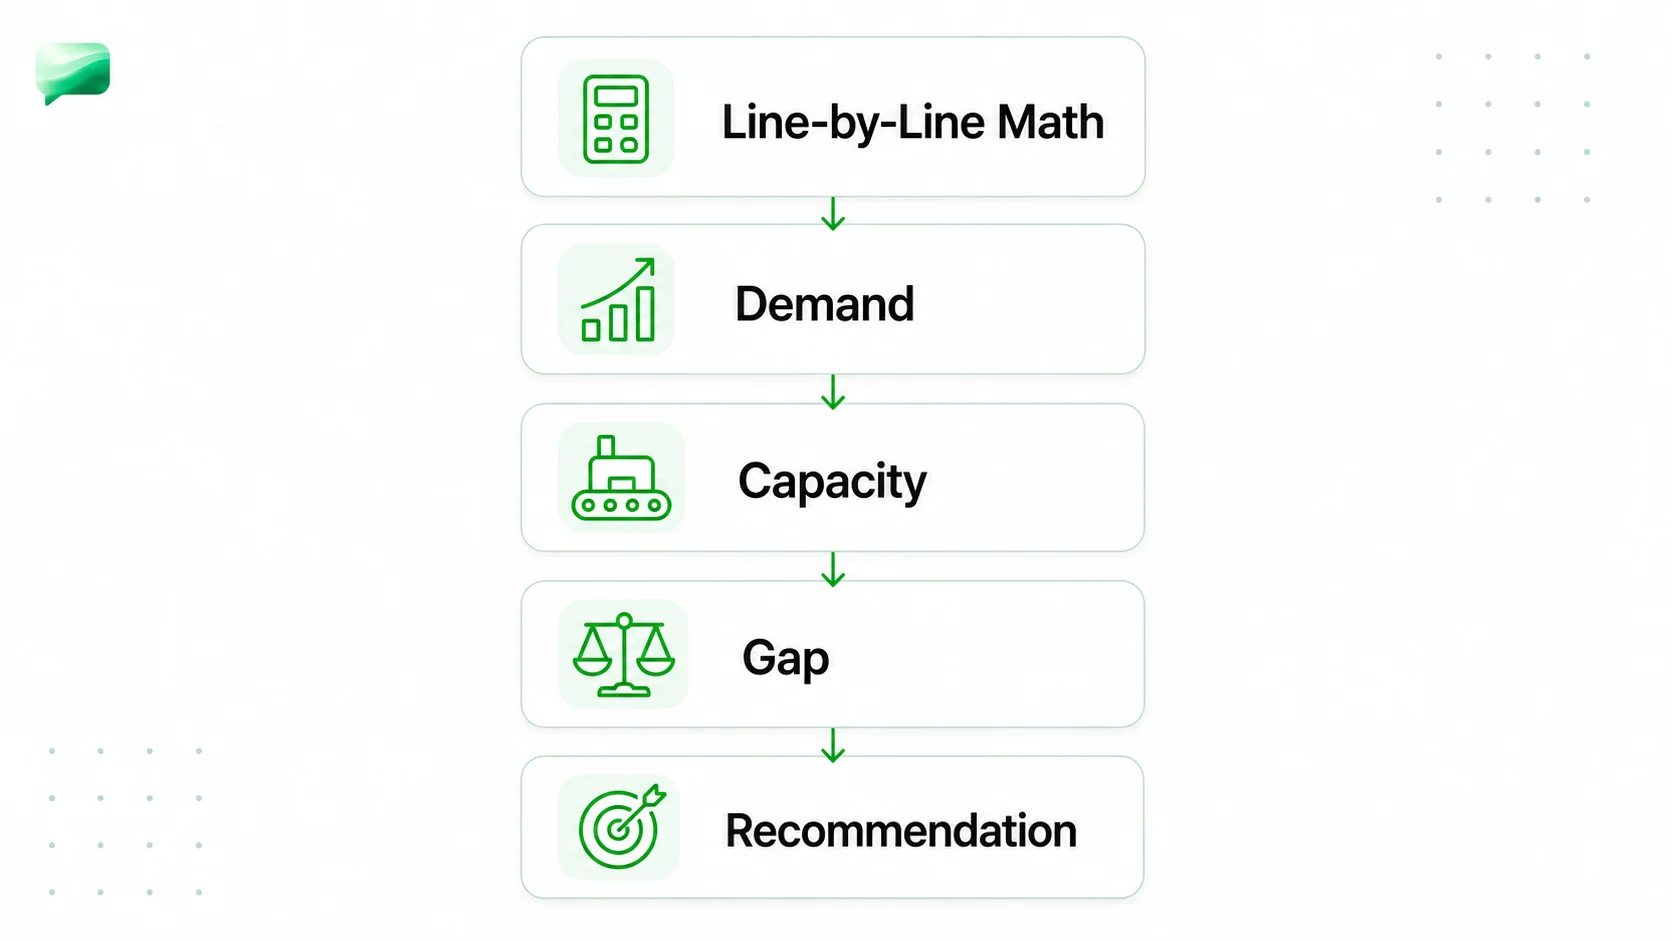
Here is one complete production optimization case worked end to end, with every calculation shown line by line.
Prompt: A furniture company runs a single assembly line that builds chairs. Management says they cannot meet demand of 700 chairs per day and wants to know why and what to do. The line has three sequential stages: cutting, assembly, and finishing. These are RTO teaching assumptions. Assume adequate buffers, no scrap or rework, sufficient inputs, and steady-state production across working days.
Step 1: Define the System
Unit of output: finished chairs per day. Target: 700/day. The line runs one 8-hour shift, but each stage loses 1 hour per shift to setup and breaks, so each stage has 7 productive hours.
Step 2: Break Into Stages and Get the Rates
Stage capacity = Rate x Time. Cutting = 120 x 7 = 840. Assembly = 80 x 7 = 560. Finishing = 100 x 7 = 700.
Step 3: Find the Bottleneck
The system throughput equals the smallest stage capacity. Cutting can do 840, finishing can do 700, but assembly caps at 560. Assembly is the bottleneck. The line produces 560 chairs/day, not 700.
Step 4: Quantify the Gap
Target is 700/day; actual is 560/day. The shortfall is 700 - 560 = 140 chairs/day. At a contribution margin of, say, $40/chair (an assumption to confirm with the interviewer), that is 140 x $40 = $5,600/day in lost contribution, or roughly $5,600 x 250 working days = $1.4M/year.
Assembly uses 100% of the stated sustainable capacity of 560/day. Against theoretical eight-hour capacity it uses 560 / 640 = 87.5%. Reclaiming the setup hour is a separate intervention to validate, not spare capacity already available.
Step 5: Relieve the Constraint (People-Process-Technology)
Focus every lever on assembly, because lifting any other stage changes nothing.
- People: Add a second assembly worker or a partial second shift on assembly only. Adding 1 productive hour back (eliminating setup loss) lifts assembly to 80 x 8 = 640/day.
- Process: Rebalance the line. Move a simple sub-task from assembly to the under-utilized cutting stage (which has 840 - 560 = 280 chairs/day of slack), lifting assembly's effective rate.
- Technology: Add a second assembly station or jig to raise the rate from 80 to, say, 100 chairs/hour, giving 100 x 7 = 700/day.
Step 6: Re-check Where the Bottleneck Moves
Say we raise assembly to 700/day with a second station. Now the three capacities are cutting 840, assembly 700, finishing 700. The bottleneck has moved: finishing is now tied at 700. To exceed 700/day you would have to relieve finishing too. This is the insight that separates strong candidates: relieving one constraint exposes the next.
Recommendation: Assembly is the binding constraint at 560 chairs/day against 700 demanded, costing roughly $1.4M/year in lost contribution. Test the cost and feasible capacity gain of a second assembly station against line rebalancing. Both remain proposals until their cost, safety, and quality effects are known. Note that hitting demand exactly maxes out finishing too, so any further growth needs both stages addressed. Confirm the $40 margin and the second-station capex before committing.
Why Operations Cases Are More Quantitative, and How to Drill the Math
Operations cases can require several linked calculations. Strategy cases let you reason qualitatively for stretches; operations cases force multi-step arithmetic almost immediately, because the whole answer hinges on comparing stage capacities and sizing a gap. The math itself is not advanced (multiplication, division, percentages), but you have to do several steps cleanly and fast, out loud, without a calculator.
The way to build this is volume, not theory. Drill these specific operations calculations until they are automatic:
- Rate x Time across multiple stages, then picking the minimum
- Utilization as a percentage and what headroom remains
- Translating a unit gap into a dollar gap via margin
- Simple payback when a lever has a capex cost
If your arithmetic is the bottleneck (the irony), fix that before anything else. Run case math drills daily and aim to finish a two-to-three-step operations calculation in under 30 seconds.
Common Mistakes in Operations Cases
1. Forcing a profitability framework onto a flow problem. The most common failure. A throughput problem does not decompose into a revenue tree and a cost tree; it decomposes into stages and a bottleneck. Diagnose the system type first.
2. Ignoring the bottleneck. Candidates propose speeding up every stage. Speeding up a non-bottleneck stage produces zero additional output. Only the constraint matters until it is relieved.
3. Jumping to solutions before root-causing. "Add a shift" is premature if you have not located which stage is constrained or why. Find the bottleneck, then prescribe.
4. Missing capacity constraints. Forgetting that demand of 700 against a 560 capacity is the entire problem, or forgetting that productive hours are less than scheduled hours, throws off every downstream number.
5. Averaging stage rates. Throughput is the minimum stage capacity, not the average. Averaging is a silent, fatal arithmetic error.
How to Prepare for Operations Cases
Preparation splits into three tracks. First, structure: drill the first-principles approach (define the system, stages, bottleneck) on varied prompts so you are not reaching for a template. Second, data interpretation: practice reading an operations exhibit (a table of stage rates, a process flow diagram) and extracting the binding constraint in seconds. Third, math fluency, as covered above.
For practice cases, the related operations and process families are the best adjacent reps. Build the cost lens with the operations cost framework, which goes deeper on fixed-versus-variable cost and cost-per-unit logic that cost-cutting cases test. For flow problems that span suppliers, plants, and distribution, the supply chain case interview guide extends the bottleneck logic across a network. And when the case is explicitly framed as taking cost out, the cost reduction case interview guide maps the levers and the quantification step.
The fastest way to find your real weakness is to run a full operations case end to end, out loud, and see whether you stall on structure, on reading the exhibit, or on the math. Treat that first case as a diagnostic, not a verdict.
Run an operations case before your interview
Practice a free operations case scored on structure, bottleneck logic, math, and recommendation quality, using Road to Offer training feedback.
Learn the Formula, Then Transfer It
Use the case-math lesson when setup or units are unclear. Use the charts and graphs guide and a graph drill when you can calculate a rate but cannot explain the implication.
Learn the case sequence before another operations rep
The MetroFresh Voice case is a distribution-center turnaround. Use it to transfer constraint reasoning to a different operating system; it does not replay the chair factory.
Sources
- StrategyCase, Operations case interview guide: (checked June 26, 2026)
- CaseBasix, Operations case interview guide: (checked June 26, 2026)
- RocketBlocks, Business operations case interviews: (checked June 26, 2026)
- PrepLounge, Operations and strategy cases: (checked June 26, 2026)
Frequently asked questions
Resources and related guides
- Practice operations in a real case interviewPractice
- Browse all free resourcesResource hub
- Automotive Case Interview: Value Chain, Examples & PrepFundamentals · Jun 30, 2026
- Banking Case Interview: Framework, Examples & PrepFundamentals · Jun 30, 2026
- Consumer Goods Case Interview: CPG Frameworks & ExamplesFundamentals · Jun 30, 2026