
Operations & Cost Optimization Framework for Case Interviews (2026)
Operations and cost optimization framework for case interviews: cost levers, supply chain analysis, process improvement, and a worked example.
On this page
Operations cases are won in the cost baseline. Before naming levers, split the cost base into real buckets, find the few that moved, and quantify how much savings each lever can realistically capture. This guide gives you the framework, then a manufacturing example you can reuse in profitability, PE portfolio, post-merger integration, and supply-chain cases. The same cost-baseline approach drives a worked airline operations case, where fuel and load factor dominate the cost structure.
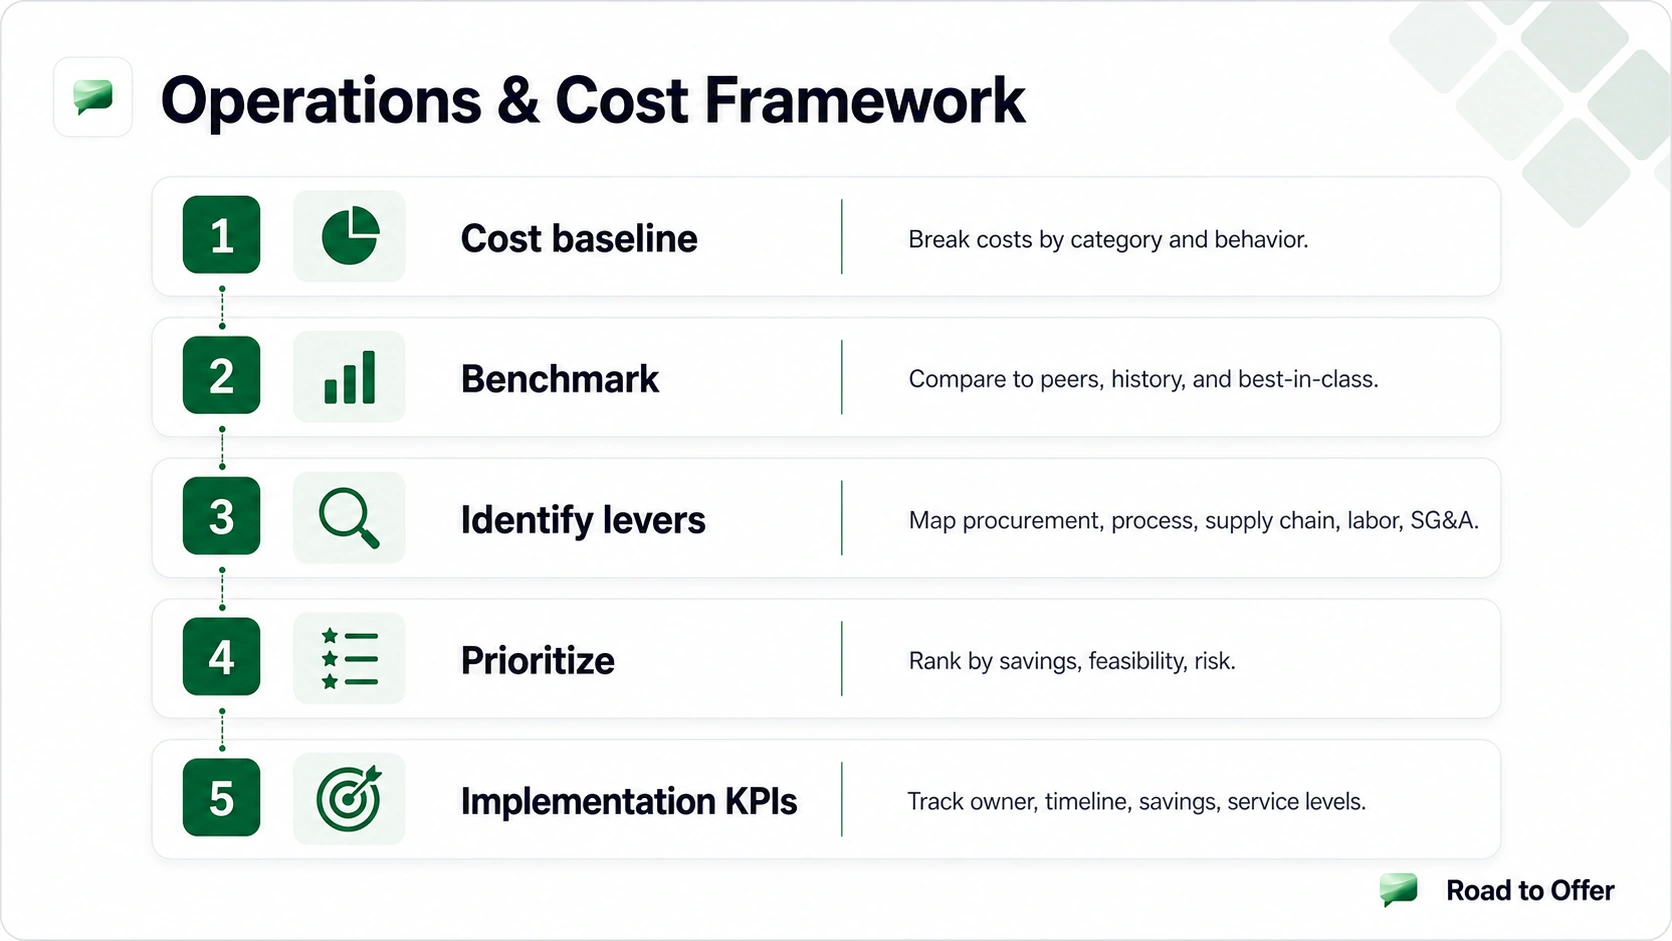
The core skill is cost decomposition. Just as profitability cases decompose profit into revenue and costs, operations cases decompose costs into specific, actionable components. Then you prioritize the levers that deliver the most impact with acceptable risk and implementation effort.
When You'll See Operations Cases
Operations cases appear in several contexts:
- Standalone cost reduction: "The CEO wants to cut costs by 15%. Where do you start?"
- Within profitability cases: The diagnosis reveals costs are the problem, and you need to go deeper.
- PE portfolio optimization: A PE fund wants to improve EBITDA at a portfolio company through operational improvement. (See the full PE Due Diligence Framework for how cost levers fit into investment thesis evaluation.)
- Post-merger integration: After an acquisition, the combined entity needs to capture cost synergies.
- Supply chain disruption: External shocks (tariffs, supply shortages, logistics bottlenecks) require operational response.
If you are preparing for an operations-heavy firm specifically, pair this framework with the Kearney case interview guide, where procurement and supply-chain cases are central to the process.
Practice cost optimization cases
Road to Offer includes operations cases with real cost data, supply chain analysis, and implementation-focused recommendations.
The Operations & Cost Optimization Framework
Step 1: Build the Cost Baseline
Before cutting anything, you need to know where the money goes. Decompose costs along two dimensions:
By category:
By behavior:
Step 2: Benchmark
Benchmarking tells you whether costs are high because of inefficiency or because of the business model. Compare:
- Peer comparison: How does the client's cost structure compare to similar companies? If competitors spend 25% of revenue on COGS and the client spends 32%, there's a 7pp gap to investigate.
- Historical comparison: How do current costs compare to 2-3 years ago? What changed?
- Best-in-class comparison: What do the most efficient operators achieve? This sets the upper bound for improvement.
- Internal comparison: If the client has multiple plants, stores, or regions, compare performance across units.
Interactive drill set. Write an answer before revealing the worked solution, then continue into Road to Offer for scored practice and AI feedback.
Master operations cases with AI practice
Full operations cases with cost baselines, benchmarks, and implementation planning. Scored feedback on cost decomposition, lever identification, prioritization, and synthesis.
Step 3: Identify Levers
The five major cost reduction lever categories:
1. Procurement and Sourcing
- Volume consolidation: Aggregate purchases across business units or geographies to negotiate volume discounts.
- Supplier rationalization: Reduce the number of suppliers to improve leverage and simplify management.
- Competitive bidding: Introduce bidding processes for contracts that were historically single-sourced.
- Specification redesign: Reduce material specifications without affecting quality (e.g., thinner packaging, alternative materials).
- Make-vs-buy analysis: Determine whether to produce in-house or outsource based on cost, quality, and strategic importance.
2. Process Improvement
- Lean principles: Eliminate waste in processes. The seven wastes: overproduction, waiting, transport, over-processing, inventory, motion, defects.
- Automation: Replace manual tasks with technology where the ROI justifies the investment.
- Standardization: Reduce process variation across sites, teams, or products.
- Bottleneck removal: Identify and address the constraint that limits throughput.
3. Supply Chain Optimization
- Network design: Optimize the number and location of warehouses, plants, and distribution centers.
- Inventory management: Reduce carrying costs through better demand forecasting, safety stock optimization, and JIT (just-in-time) practices.
- Transportation optimization: Route optimization, mode shifting (e.g., rail vs truck), and load consolidation.
- Demand planning: Improve forecast accuracy to reduce both stockouts and excess inventory.
4. Labor and Workforce
- Productivity improvement: More output per labor hour through training, process improvement, or technology.
- Workforce planning: Right-size headcount based on workload analysis, not across-the-board cuts.
- Span of control: Reduce management layers where they add cost without value.
- Outsourcing/offshoring: Move lower-value activities to lower-cost locations.
5. Overhead and SG&A
- Real estate optimization: Consolidate offices, renegotiate leases, or adopt hybrid work models.
- Shared services: Centralize back-office functions (finance, HR, IT) to eliminate duplication.
- Technology rationalization: Eliminate redundant software licenses, consolidate platforms.
- Travel and discretionary spending: Often the first and easiest cuts, but limited in total impact.
Step 4: Prioritize with an Impact-Feasibility Matrix
Not all levers are equal. Prioritize using two dimensions:
Impact = annual savings potential in dollars or percentage of cost base. Feasibility = time to implement, capital required, organizational resistance, and execution risk.
Step 5: Build the Implementation Plan
Strong recommendations include:
- Phased timeline: Quick wins (0-3 months), medium-term initiatives (3-12 months), structural changes (12+ months).
- Ownership: Who is accountable for each initiative?
- Investment required: Some cost reduction requires upfront capital (automation, technology, restructuring).
- KPIs and tracking: How will you measure progress? Define specific metrics for each initiative.
- Risk mitigation: What could go wrong? How do you prevent cost cuts from degrading quality, service, or employee morale?
Practice operations cases with implementation focus
Our cases include cost baselines, benchmarks, and implementation planning. Get scored feedback on your cost decomposition, prioritization, and recommendations.
Worked Example: Manufacturing Cost Reduction
Case prompt: A mid-size auto parts manufacturer has seen EBITDA margins decline from 14% to 9% over three years, despite stable revenue of $600M. The PE owner wants a cost reduction plan to restore margins to 12% within 18 months.
A. Cost Baseline
Revenue: $600M (stable) Target: Restore EBITDA from 9% ($54M) to 12% ($72M), a $18M improvement.
B. Diagnose the Drivers
The $18M gap comes primarily from:
- Raw materials: +4pp = +$24M (largest driver)
- Logistics: +2pp = +$12M
- Manufacturing overhead: +1pp = +$6M
- These are partially offset by minor savings elsewhere (-$6M)
C. Identify Levers
Raw materials ($24M increase):
- Supplier consolidation: reduce from 47 suppliers to 20-25 through competitive bidding → estimated $8-10M savings
- Specification redesign: work with engineering to identify 3-5 components where alternative materials meet quality standards at lower cost → estimated $4-6M savings
- Volume rebate renegotiation: consolidate purchases quarterly instead of monthly to trigger volume discount tiers → estimated $2-3M savings
Logistics ($12M increase): 4. Network optimization: close 1 of 4 regional warehouses and reroute through the remaining 3 → estimated $4-5M savings 5. Mode shifting: move 30% of non-urgent shipments from truck to rail → estimated $2-3M savings 6. Load consolidation: improve truck utilization from 72% to 85% through better scheduling → estimated $1-2M savings
Manufacturing overhead ($6M increase): 7. Energy efficiency: install variable-speed drives on major equipment, renegotiate energy contracts → estimated $2-3M savings 8. Maintenance optimization: shift from reactive to preventive maintenance program → estimated $1-2M savings
D. Prioritize
Total estimated savings: $24-34M (target was $18M, providing a buffer for execution shortfalls).
E. Recommendation
"I recommend a phased cost reduction program targeting $24-34M in annual savings, well above the $18M needed to restore 12% EBITDA margins. The first phase (months 1-3) focuses on quick wins: volume rebate renegotiation, load consolidation, and mode shifting, delivering approximately $5-8M with minimal investment. The second phase (months 3-12) tackles the largest drivers: supplier consolidation and warehouse rationalization, delivering $12-15M but requiring more organizational effort and $2M of upfront investment. The key risk is that supplier consolidation could temporarily disrupt supply continuity, so I'd recommend a staged approach, renegotiating the top 10 suppliers first before expanding. Track savings realization monthly against a bridge to the $18M target."
Cut the cost base in a Bain operations case. A US motorcycle maker's production costs have risen 18% in three years. Answer this Bain operations case step in the article, then continue the full case. Continue the full case on Road to Offer
Common Mistakes in Operations Cases
- Recommending across-the-board cuts. "Cut every department by 10%" destroys productive capacity alongside waste. Be surgical.
- Ignoring implementation costs. Some cost reduction levers require upfront investment. A $5M annual saving that requires $20M capex has a 4-year payback. Factor this in.
- Forgetting quality and service impacts. Cutting raw material costs by switching to cheaper suppliers might save money short-term but increase defect rates. Always consider second-order effects.
- No prioritization. Listing 15 cost reduction ideas without ranking them by impact and feasibility isn't a recommendation. Focus on the top 3-5 levers that deliver 80% of the savings.
- Missing the structural vs cyclical distinction. Are costs high because of structural inefficiency (fixable) or because of market conditions (raw material prices, labor market tightness)? The solutions differ.
Related Frameworks
Operations cases connect to several other case types:
- Case Interview Frameworks Complete Guide, the master selector that shows when operations cost sits inside a profitability case versus as a standalone structure
- Profitability Framework, when cost is the diagnosis in a profitability case
- Operations Case Interview, the full archetype guide covering efficiency, throughput, and service-level cases where this cost framework is the core tool
- Cost Reduction Case Interview, the companion guide for cost-reduction-specific cases
- Value Chain Framework, for diagnosing where cost leaks occur across the value chain
- M&A Case Framework, for post-merger integration and synergy capture
- Driver Tree, for mapping top-level cost metrics to the operational inputs that drive them
- Case Interview Examples, including operations-focused worked cases
- Pricing Strategy Cases, the revenue side of the profit equation
Sources and Further Reading (checked June 17, 2026)
- McKinsey Operations Practice: mckinsey.com/business-functions/operations
- Bain Operations Consulting: bain.com/consulting-services/operations
- Deloitte Operations Transformation: deloitte.com/operations
- PrepLounge operations case guide: preplounge.com/en/case-interview-basics/case-cracking-toolbox/identify-your-case-type/operations-case
- Lean Enterprise Institute, seven wastes: lean.org
Frequently asked questions
Resources and related guides
- Practice operations in a real case interviewPractice
- Browse all free resourcesResource hub
- Cost Reduction Case Interview: Framework, Worked Examples, and Common Traps (2026)Frameworks · Mar 20, 2026
- Restructuring Case Interview: Framework, Turnaround Strategy, and Worked Examples (2026)Frameworks · Mar 20, 2026
- Value Chain Framework for Case Interviews: Diagnose Margin Leaks FastFrameworks · Feb 6, 2026