Market Sizing Framework: Top-Down vs Bottom-Up, Step by Step (2026)
The complete market sizing framework: the top-down vs bottom-up decision rule, a 5-step method, worked examples, a cheat-sheet table, and practice questions.
On this page
Market sizing cases ask you to estimate a market's total revenue, units, or customers using top-down or bottom-up approaches with explicit assumptions. They appear in roughly 25% of McKinsey, BCG, and Bain first-round interviews and in nearly every market entry case, according to IGotAnOffer. Interviewers score your reasoning structure more heavily than the exact number; your target is to land within one order of magnitude. This guide covers a repeatable 5-step method, 6 fully worked examples across B2C, B2B, and service markets, a reference data table for 5 countries, and the one step most candidates skip: stating what the number means for the client's strategy.
Run one real market sizing drill
Before reading more examples, run one live market sizing rep. The platform will grade your structure, assumptions, math, sanity check, and implication, then prompt you to continue into the same drill type after completion.
What is market sizing?
Market sizing is a case interview question type where you estimate the total size of a market (revenue, units, or customers) using logical segmentation and stated assumptions, without research databases. It tests structure and communication, not memorization. Per PrepLounge, the three golden rules are answer-first structure, sanity check, and strategic implications.
Why does market sizing show up in every interview round?
The answer drives strategic decisions: enter this market, price at this point, target this revenue. McKinsey, BCG, and Bain use these questions to evaluate how you decompose ambiguity. The exact number matters less than clear MECE reasoning.
Per Management Consulted, it appears in ~1 in 4 first-round cases. Bain dedicates an entire first-round session to estimation in many countries; McKinsey often uses standalone sizing as a warm-up; Capital One uses the same estimation muscle in business analyst cases, covered in the Capital One case interview guide. We break down MBB pay vs Tier 2 in the 2026 Consulting Salary Report. For wider context, see the case interview frameworks complete guide.
Interviewers score 3 dimensions: structure (logical tree before numbers), judgment (assumptions tied to reference points), and communication (narrate as you go).
What are TAM, SAM, and SOM?
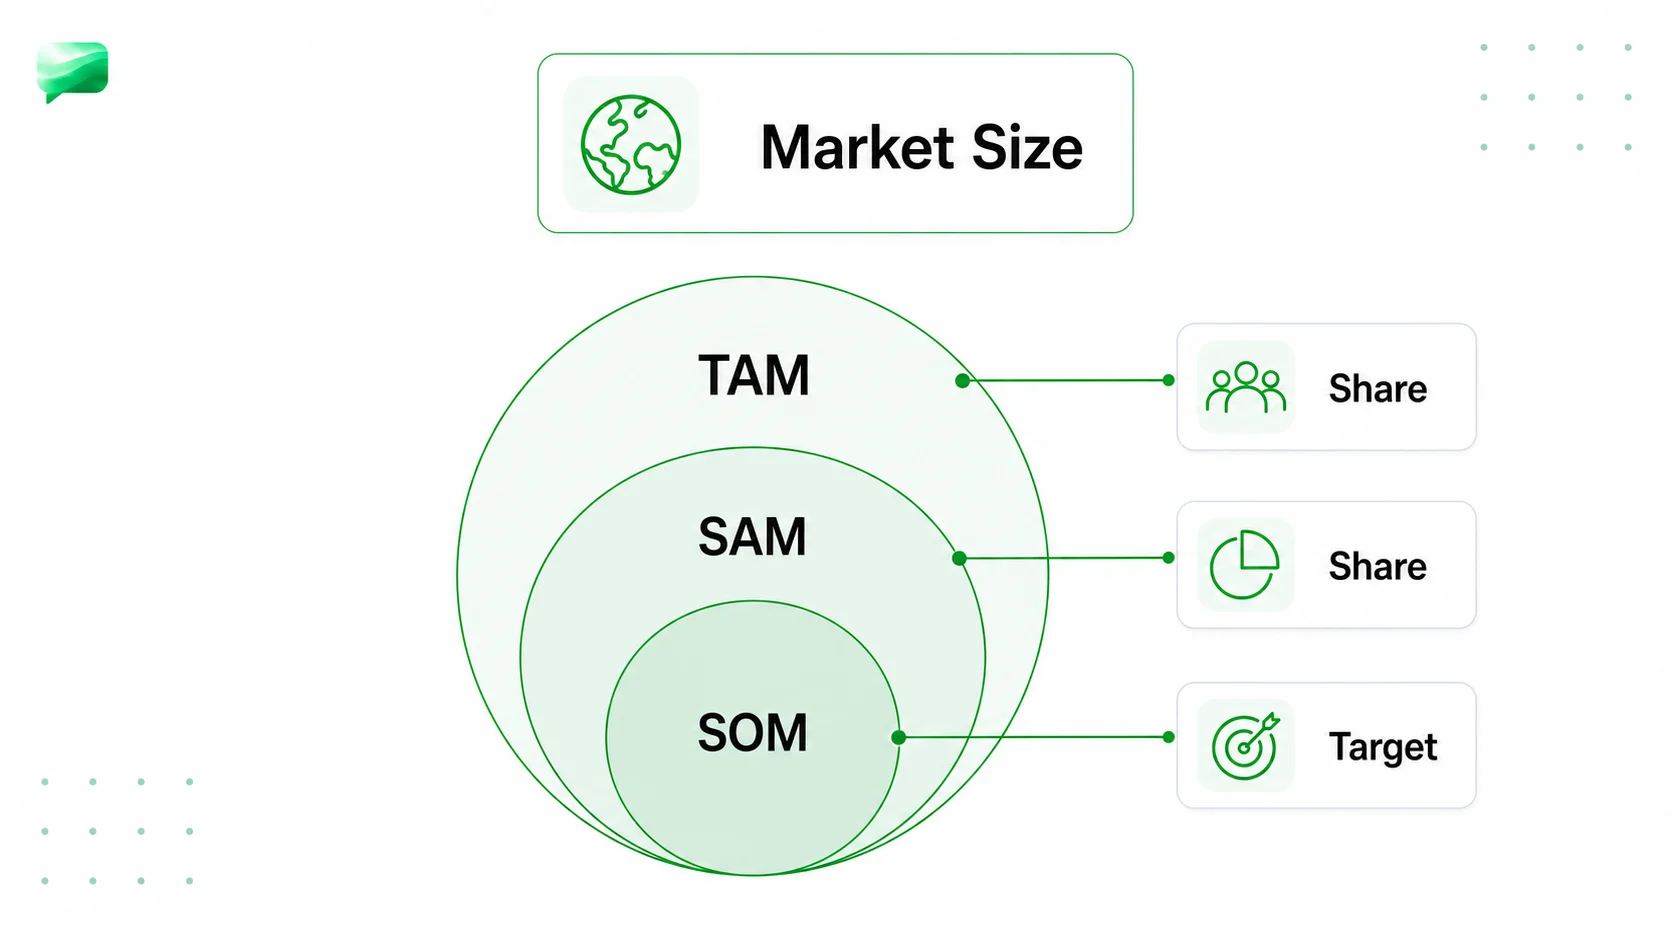
Markets break down from total opportunity to realistic target. Interviewers often want a specific slice.
- TAM (Total Addressable Market): Total demand at 100% share.
- SAM (Serviceable Available Market): The portion you can reach by geography, channel, and product fit.
- SOM (Share of Market): The portion you realistically capture given competition.
When the interviewer says "size this market," ask whether they want TAM or something narrower. The same logic feeds market entry framework cases, where TAM is the numerator for share calculations.
Market Sizing Cheat Sheet: what numbers should I memorize?
Memorize these approximate figures so you can anchor estimates. This is the reference cheat sheet to internalize before interview day. Sourced from World Bank Open Data and US Census Bureau 2024 estimates.
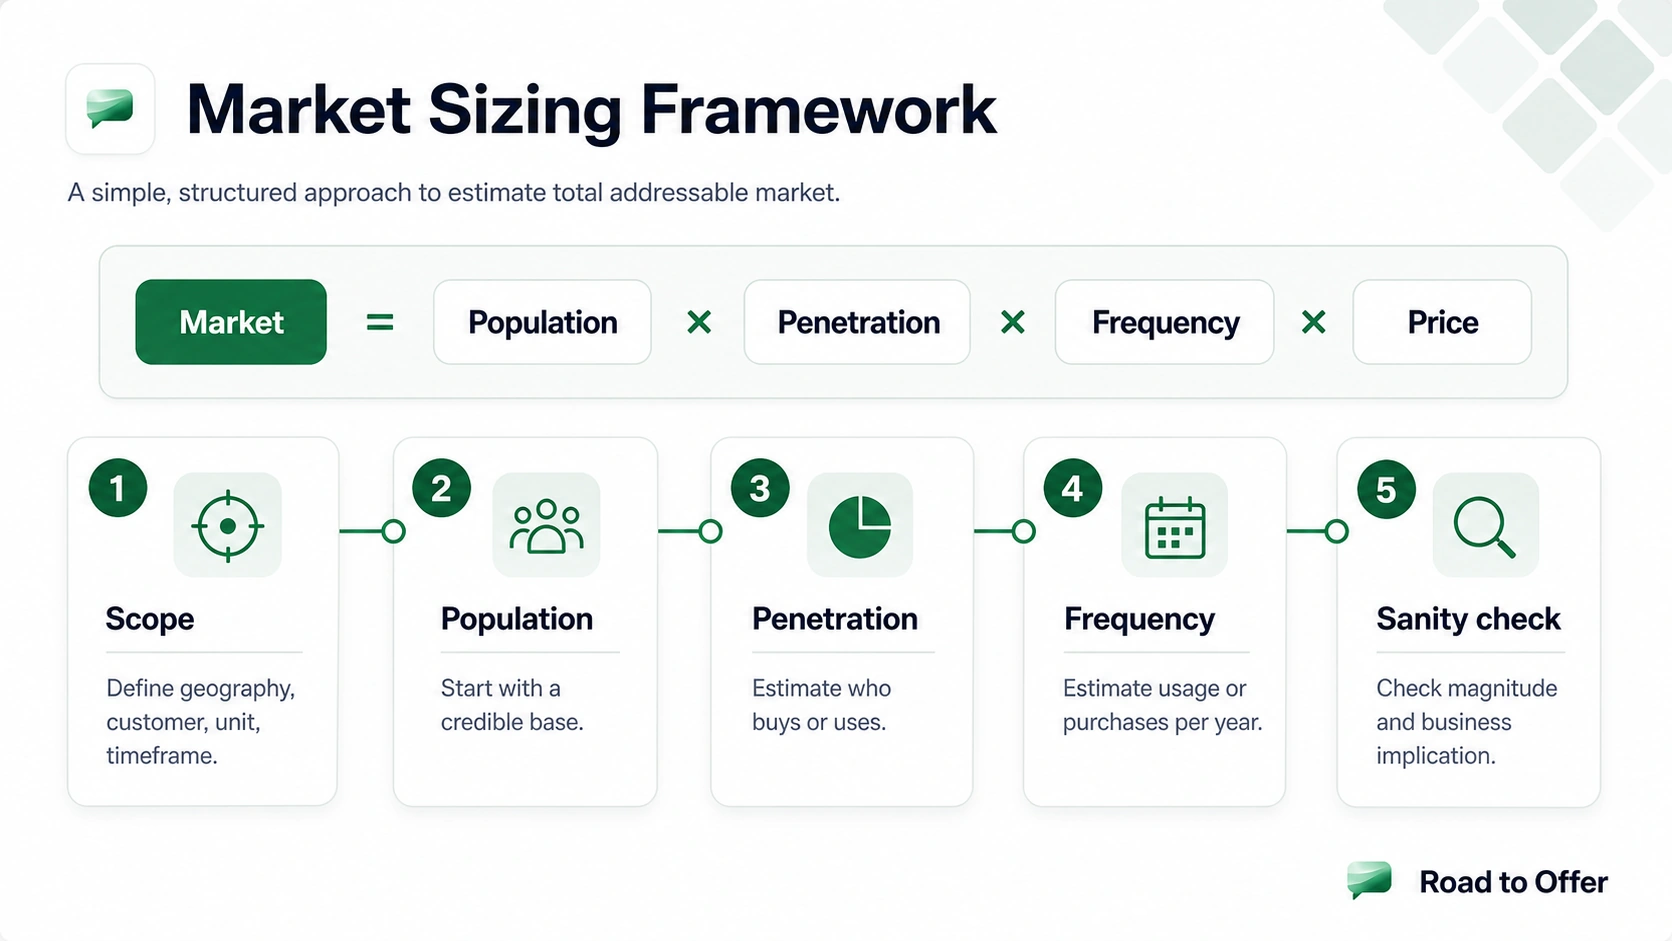
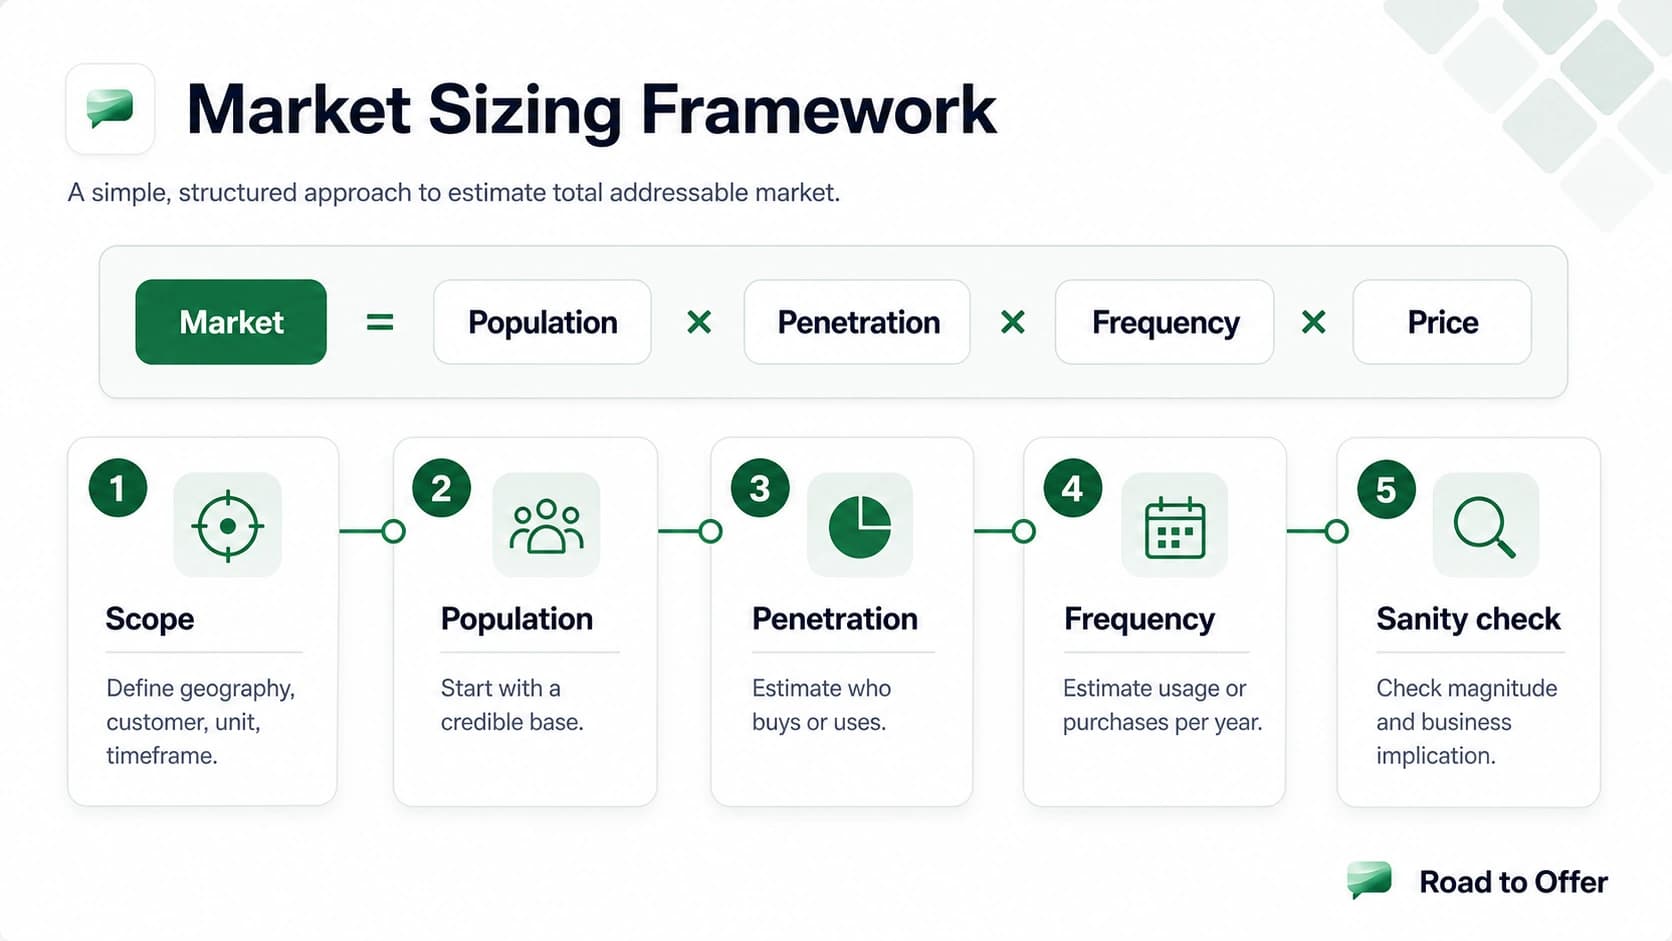
How does the 5-step method work?
Use the same mental sequence every time. The fifth step (implications) turns a number into a recommendation, which is what consultants actually do.
This method aligns with how you would structure any case interview question. The difference: market sizing is self-contained because you generate your own data through assumptions.
Step 1: How do I clarify the question?
Lock down 3 things before any math:
- What are we sizing? Revenue, units, or customers produce different numbers.
- Geography and time. "US, last 12 months" is specific. "Global market" is not.
- Exclusions? B2B vs B2C, certain channels, certain segments.
Skipping clarification is the most common market sizing mistake (see how to practice case interviews). One or two sharp questions take 30 seconds and save you from solving the wrong problem.
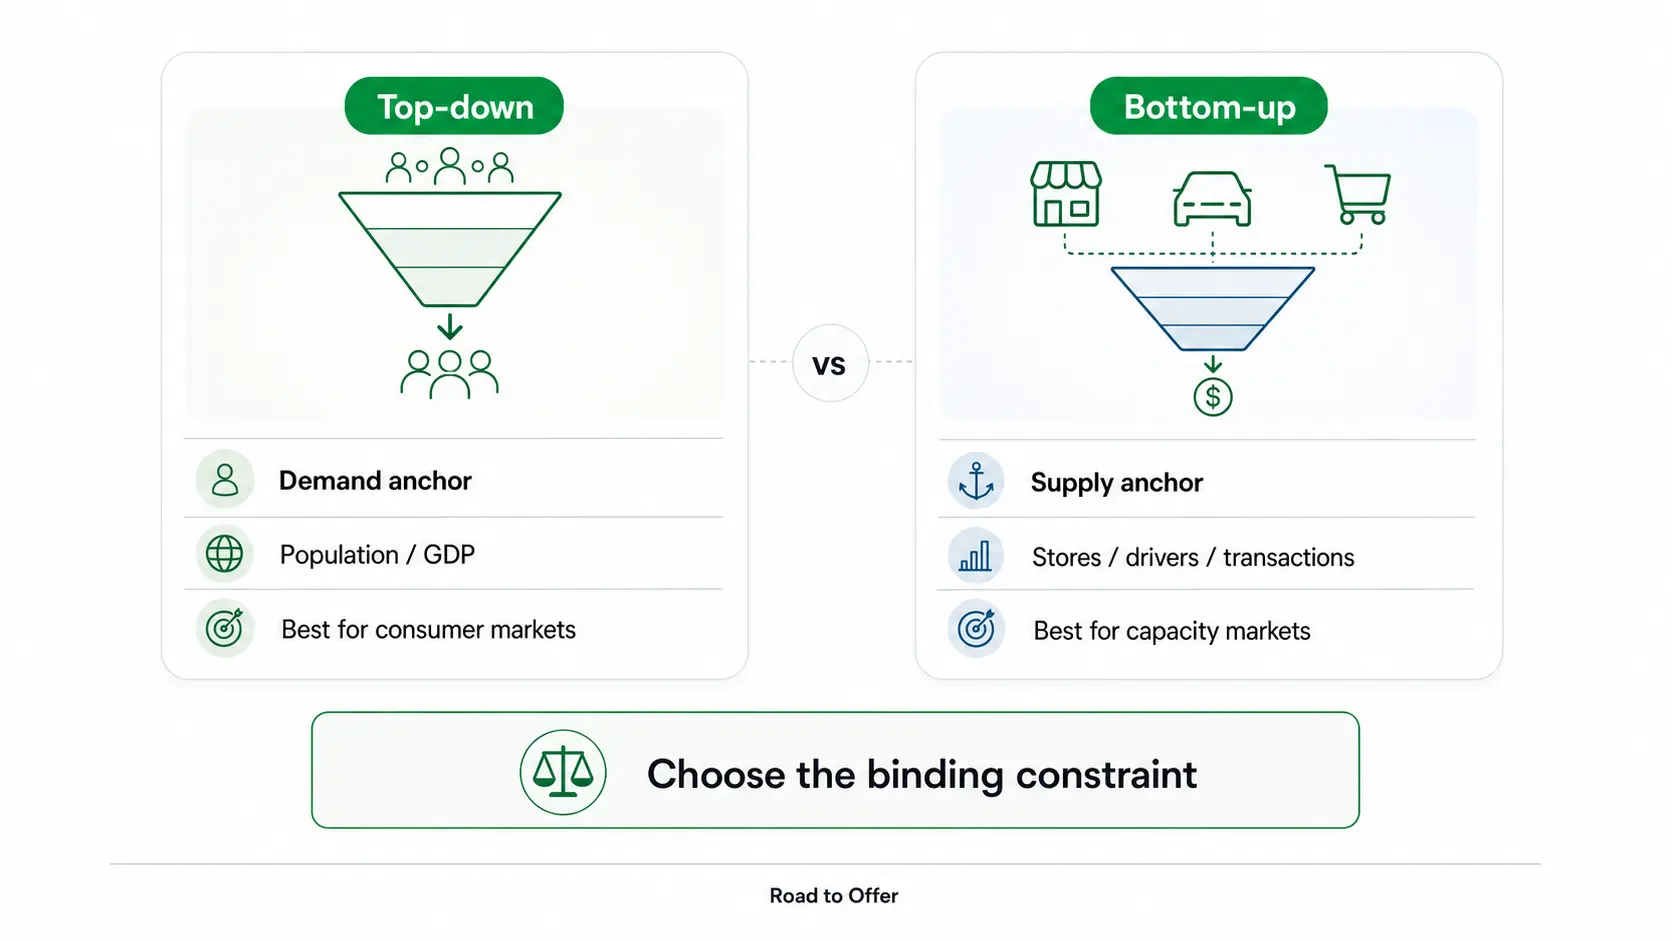
Step 2: How do I choose top-down vs bottom-up?
Ask one question: what is the binding constraint in this market? If demand is the natural anchor (a defined population of customers), go top-down and start from total population or GDP, then filter down. If supply capacity defines the market (number of stores, drivers, beds, machines), go bottom-up and build up from one unit. State your choice out loud before any math; the narration is what interviewers listen for. The full decision matrix is in the next section.
Step 3: How do I segment cleanly?
For customer segmentation in more complex sizing questions, break the population into 2 or 3 distinct groups with different usage patterns rather than applying one average. More than 3 segments and you will run out of time or compound arithmetic errors.
Write the formula on paper before any calculation (a case interview formulas reference is useful to have internalized before interview day). Each branch should be MECE: mutually exclusive, collectively exhaustive. A well-built tree means the interviewer can point at any node and ask "why that number?" and you have an answer ready.
Step 4: How do I calculate without errors?
- Use round numbers (340M, $75K). Mental math stays fast.
- State each assumption out loud so the interviewer can correct or steer.
- Anchor to reference points ("10% penetration, similar to early adoption curves").
For arithmetic tactics, see mental math for case interviews, case interview math mental shortcuts, and case interview math practice. Sharpen the calculation reflex with Quick Math before interview week.
Penetration rates are where most candidates lose judgment points. Anchor to the product lifecycle so your number is defensible: early-market adoption 5 to 15%, a mature consumer product with mass appeal 30 to 50%, and ubiquitous infrastructure (email, smartphones, running water) 80 to 95%. Claiming 80% adoption for a new product is a red flag interviewers catch immediately.
Step 5: How do I sanity-check and state implications?
Compare to a known benchmark ("~0.1% of GDP, plausible for this category"). State a range. Per IGotAnOffer's playbook: if you catch the mistake first, you stay alive; if the interviewer catches it first, you do not.
Then state implications:
- "At $30B, large enough to enter, but our client captures under 1% so differentiation is critical."
- "At 50K units per year, niche. Weigh whether margins justify the investment."
- "At ~$2B, 5% share in 3 years = $100M and ~200 enterprise reps at typical SaaS productivity."
Every number ties back to a recommendation. See case interview synthesis.
How do you decide between top-down and bottom-up?
This is the single highest-leverage call in a sizing answer, and it comes down to one question: what is the binding constraint? Top-down (demand-side) starts from a large anchor (population or GDP) and applies filters toward the target. Bottom-up (supply-side) starts from a single unit (one store, one driver, one day of operations) and scales up. Top-down fits consumer markets roughly 80% of the time; bottom-up wins for B2B, infrastructure, and physical-location businesses where supply is easier to count than demand. Per Management Consulted, top-down is the preferred approach for most interview questions, but the wrong anchor is a common scored failure.
What is the proxy-based variant?
When there is no clean population anchor and supply is hard to count directly, use a proxy: an indirect metric you can estimate to reach the target. The classic example is the piano tuners in Chicago brain teaser:
- Chicago city population ~2.7M, ~1M households (city proper, not the ~9.5M metro).
- % with a piano ~5% = 50,000 pianos (the proxy).
- Tuning frequency once per year = 50,000 tunings.
- Tuner throughput: 4 tunings per day x 250 days = 1,000 tunings per year.
- Piano tuners: 50,000 / 1,000 = ~50 tuners.
The proxy is the number of pianos, estimated from households and an ownership rate. Per PrepLounge, this method is essential when direct demand estimation is impossible. Only reach for a proxy when no clean population or supply anchor exists; proxies add noise. Scope drives the result: this city-proper cut lands near 50 tuners, while the full Chicago-metro version (worked in the practice questions below) lands closer to 250, so state your scope up front.
Should I run both approaches?
When time allows, yes. Running both gives you a cross-check: if the two estimates diverge by more than 2 to 3x, one of your formulas has a structural gap, usually an excluded segment. Reconciling the two demonstrates analytical maturity and is one of the highest-leverage moves in a sizing answer. With only 4 minutes left, pick one approach and defend it rather than half-finishing two trees. Several worked examples below run both and reconcile.
Bottom-Up Market Sizing Example: US coffee shop revenue
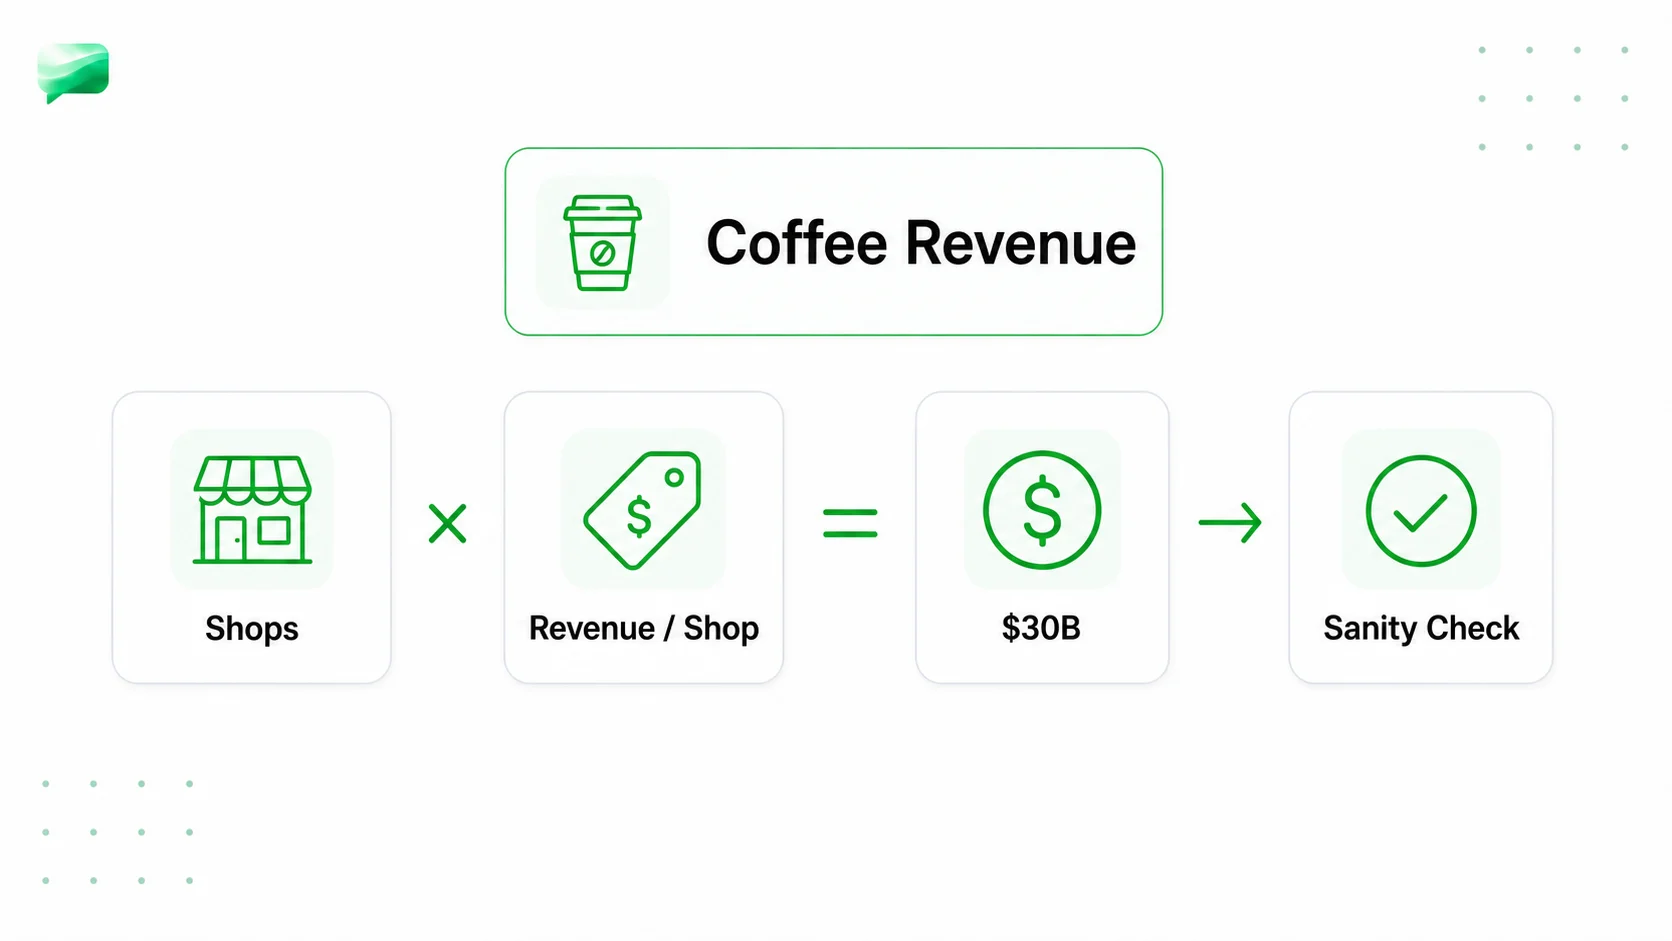
Clarify: US revenue of coffee shops (chains and independents) in the last 12 months. Revenue only.
Approach: Bottom-up. Number of shops is more reliable than counting drinkers.
Tree: Revenue = shops x average revenue per shop.
Estimate:
- Shops: US population ~340M. One shop per 3,000 people = ~110K shops. Round to 100K.
- Revenue per shop: Starbucks does ~$1.5 to $2M; independents far less. Assume $300K average. 100K x $300K = $30B.
Sanity-check: US food-away-from-home spending ~$1T per year (USDA ERS). Coffee shops at 3% of that ($30B) feels right. National Coffee Association reports 66% of Americans drink coffee.
Implications: "Mature, competitive market. For a new entrant, the play is not growing the pie but capturing share through differentiation (specialty drinks, convenience, subscription)."
Range: $25 to $35B.
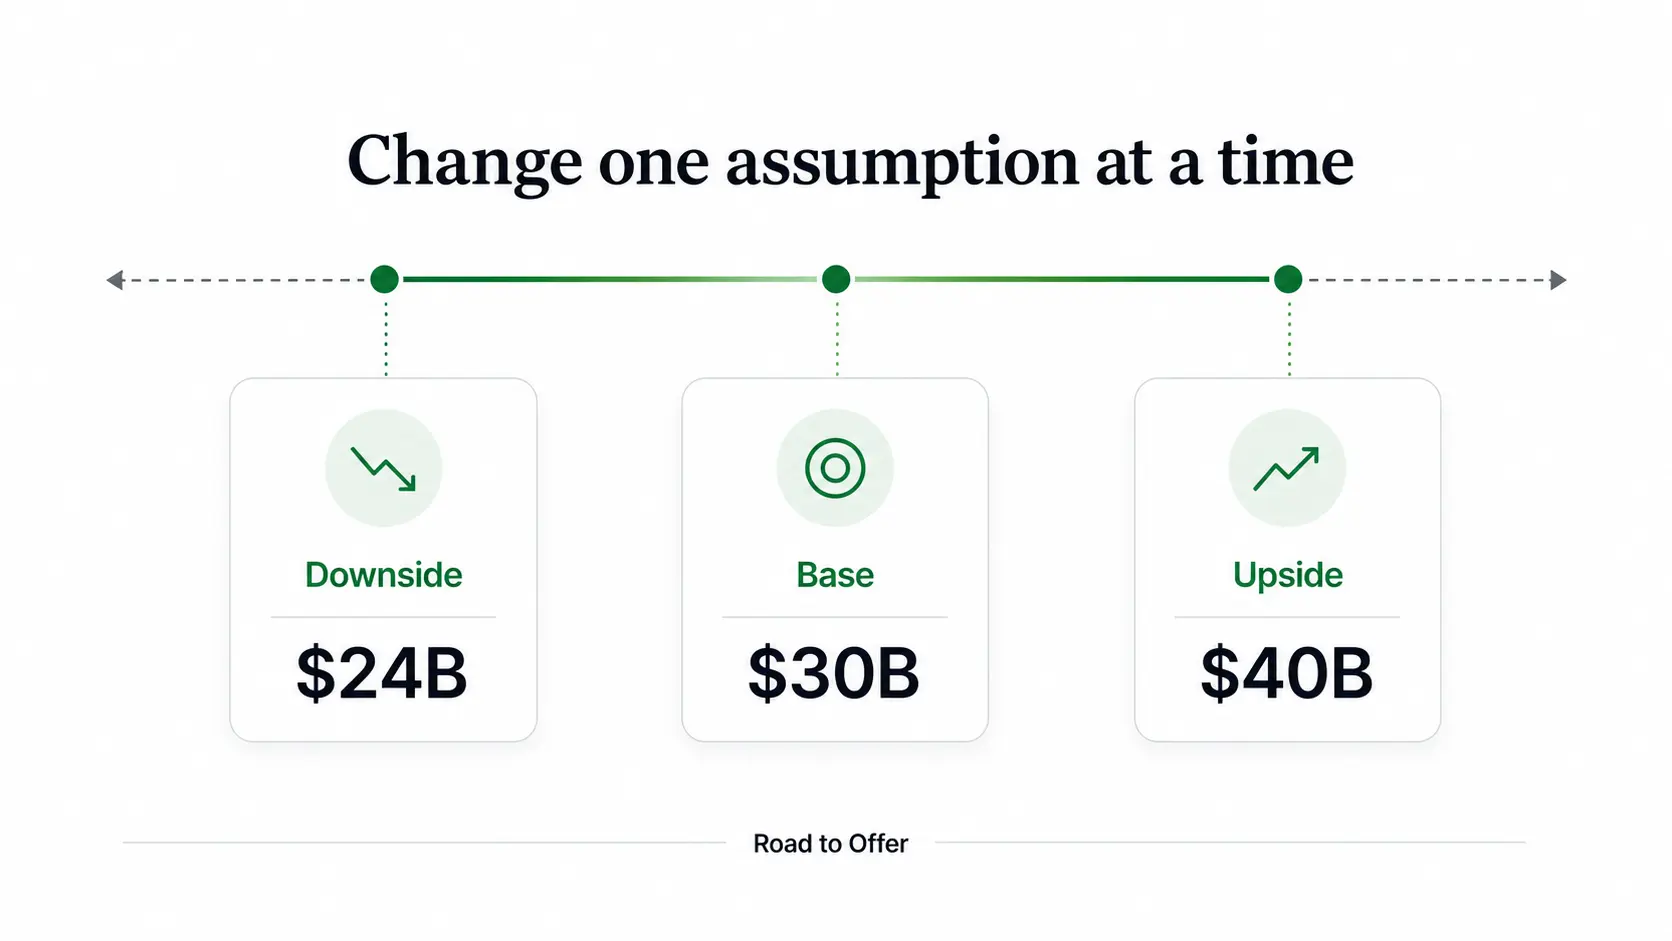
How do I show sensitivity?
Vary one assumption to stress-test. +20% shops: ~$40B. -20% revenue per shop: ~$24B. Then: "My base is $30B. Range: $24 to $40B." The same analysis appears in profitability framework cases.
How would I size the US diaper market (bottom-up, consumer goods)?
Clarify: Disposable diapers used in the US per year.
Tree: Diapers = children in diapers x diapers per day x 365.
Estimate:
- Children in diapers: US births ~3.6M per year. Diapers from birth to age ~2.5 = 3.6M x 2.5 = 9M children.
- Diapers per day: Newborns ~10, toddlers ~5. Average ~7.
- Total: 9M x 7 x 365 = ~23B diapers per year.
Sanity-check: US diaper market ~$10 to $12B per year (Statista). At $0.30 to $0.40 per diaper, that implies 25 to 40B. Our 23B is on the low end; order of magnitude is right.
Implications: "High-volume business where small per-unit cost efficiencies create significant margin. A new entrant should think distribution scale and supply chain, not differentiation."
Range: 20 to 28B diapers.
How would I size US enterprise SaaS licenses (top-down, B2B)?
Clarify: Enterprise SaaS licenses (businesses with 500+ employees) sold in the US per year.
Estimate (top-down):
- Enterprises (500+ employees): ~20,000 per US Census SUSB.
- Average employees per enterprise: ~5,000 (skewed distribution).
- Total enterprise employees: 20,000 x 5,000 = 100M.
- SaaS licenses per employee: ~8 paid tools average (range 5 to 15).
- Total: 100M x 8 = 800M licenses per year.
Sanity-check: US enterprise SaaS market is ~$150 to $200B (Gartner). At $150 to $250 per license, 800M implies $120 to $200B. Aligns.
Implications: "Volume is enormous but the market is concentrated (Microsoft, Salesforce, SAP). A new entrant should target a specific workflow gap, not try to be the ninth tool on every desk."
Range: 600M to 1B licenses.
Case Prep Playbook
Learn market sizing
Segmentation, anchors, sanity checks, then scored reps.
How would I size daily rideshare trips in Paris (top-down)?
Clarify: Daily rideshare trips in Paris (city proper, ~2.2M), all providers combined.
Estimate (top-down):
- Addressable users: 2.2M x 50% (ages 20 to 50) x 30% rideshare penetration = ~330K registered users.
- Daily activity: 5% ride on any given day = ~16,500 daily users.
- Trips per user per day: 1.5 (there and back, or one way).
- Total: 16,500 x 1.5 = ~25,000 trips per day.
Bottom-up cross-check: ~3,000 active drivers x ~9 trips per shift = ~27,000 trips per day. Consistent.
Sanity-check: Paris Metro carries ~4M trips/day. Rideshare at under 1% of metro volume is plausible.
Implications: "At 25K trips per day with average fare ~$15, the market is small in volume but high value. Competing on price against Uber requires massive subsidy. A premium or niche segment (airport, corporate) is a better angle."
Range: 20 to 35K trips per day.
Top-Down Market Sizing Example: US fitness industry revenue
This shows a pure top-down approach starting from GDP.
Clarify: Total US fitness revenue (gyms, studios, training, apps) in the last 12 months.
Estimate:
- US GDP: ~$27T. Consumer spending ~68% = ~$18T.
- Health and wellness spending: ~5% of consumer spending = ~$900B.
- Fitness as share of wellness: ~12% = ~$108B.
- Narrow to fitness services (excluding home equipment, ~30%): ~$75B.
Bottom-up cross-check: ~65M Americans have gym memberships (Health & Fitness Association). Average ~$550/year. Memberships alone: $36B. Add training, boutique studios ($150 to $200/month), and apps for ~$70 to $80B.
Sanity-check: Statista puts gym revenue at $35 to $40B; broader fitness services $80B+. Our $75B is in range.
Implications: "At $75B, large but fragmented. No single chain controls more than 10%. The opportunity is not more gyms but a platform across the fragmented ecosystem (scheduling, payments, content)."
Range: $65 to $90B.
What are the most common market sizing mistakes?
- Skipping clarification and sizing the wrong thing or geography. Most frequent error, easiest to avoid.
- Mumbling assumptions instead of stating them. The interviewer needs to hear each number and its rationale.
- Overcomplicating with too many segments. Three is usually enough; more than five and you run out of time.
- Ignoring the sanity check and not comparing to reality.
- Stopping at the number without interpreting what it means.
For more on structuring case answers, see the growth strategy guide and case interview examples for practice with different case types.
How do I practice market sizing efficiently?
Reading is step one. Skill comes from timed, evaluated repetition.
- Week 1: 10 questions in writing, no timer. Build pattern recognition on top-down vs bottom-up.
- Week 2: Add a 5-minute timer. Clean structure under pressure.
- Week 3: Practice out loud. Record yourself once and review.
- Week 4: Get evaluated. Human feedback is irreplaceable for structure points.
Once the method clicks, work the 20 worked examples below across tech, retail, healthcare, transportation, and B2B. Learn the method here, then run more reps on our free market sizing drills. For sequencing, see the consulting interview prep timeline and case interview cheat sheet.
What sizing prompts should I drill?
Work through these. Your structure matters more than matching the exact number.
How does market sizing connect to other case types?
Market sizing rarely stands alone. It feeds bigger questions:
- Market entry: "Is this market big enough to enter?" Sizing gives the numerator for share calculations.
- Pricing: "What price captures maximum value?" Needs market size to compute revenue at different points. See pricing strategy cases.
- Growth: "Where should we grow next?" Sizing adjacent markets compares opportunities.
- Profitability: "Why is revenue declining?" Distinguishing market shrinkage from share loss requires sizing.
Firm-specific guides like the McKinsey case interview guide and BCG case interview guide flag where each firm leans hardest on sizing.
How fast should my mental math be?
Aim for under 10 seconds per operation without a calculator. Common ones: multiplying millions and billions (340M x 0.05 = 17M), percentages ("what is 0.2% of $27T?"), and division for sanity checks ("$45B / 340M = ~$132 per person per year"). Build that speed with the Quick Math tool and the mental-math guides linked above.
Sources (checked June 17, 2026)
IGotAnOffer market sizing guide, Management Consulted, PrepLounge basics, McKinsey, BCG, Bain, US Census Bureau 2024 population, US Census SUSB, World Bank Open Data, USDA ERS, Statista fitness, Statista diapers, Gartner, Health & Fitness Association, National Coffee Association.
Related guides
FAQ
Frequently asked questions
Keep reading
- Start free consulting drillsPractice
- Best Market Sizing Practice Resources (Worked Examples + Drill Plan)Math And Quant · Jun 3, 2026
- Case Interview Math: Mental Shortcuts to Calculate FasterMath And Quant · Mar 1, 2026
- Case Interview Math Practice: 30 Drills, Questions, and SolutionsMath And Quant · Feb 6, 2026