Cost Reduction Case Interview: Framework, Worked Examples, and Common Traps (2026)
Master cost reduction cases with a structured framework, worked examples (manufacturing and SaaS), and the traps that trip up most candidates.
On this page
Cost reduction cases test whether you can find where a cost base can shrink without hurting revenue or competitive position. Choose one cost tree (fixed vs. variable, or value chain), benchmark each bucket against company-specific or interviewer-provided data, then rank levers by impact, feasibility, and speed before you recommend a cut.
 McKinsey
Operations · hard
Practice a cost-tree case live
Cut costs without hurting service quality, scored end to end.
Two Cost Tree Approaches
Choose one approach based on industry; using both simultaneously creates overlapping categories.
Fixed vs. Variable (default for services and SaaS)
Value Chain (best for manufacturing, retail, CPG)
The value chain approach is more powerful for manufacturing because it maps directly to operational processes (Hacking the Case Interview).
Build a MECE cost tree under time pressure from the Road to Offer drill engine: a real prompt, your answer, and AI-scored feedback. Free account includes free daily drills.
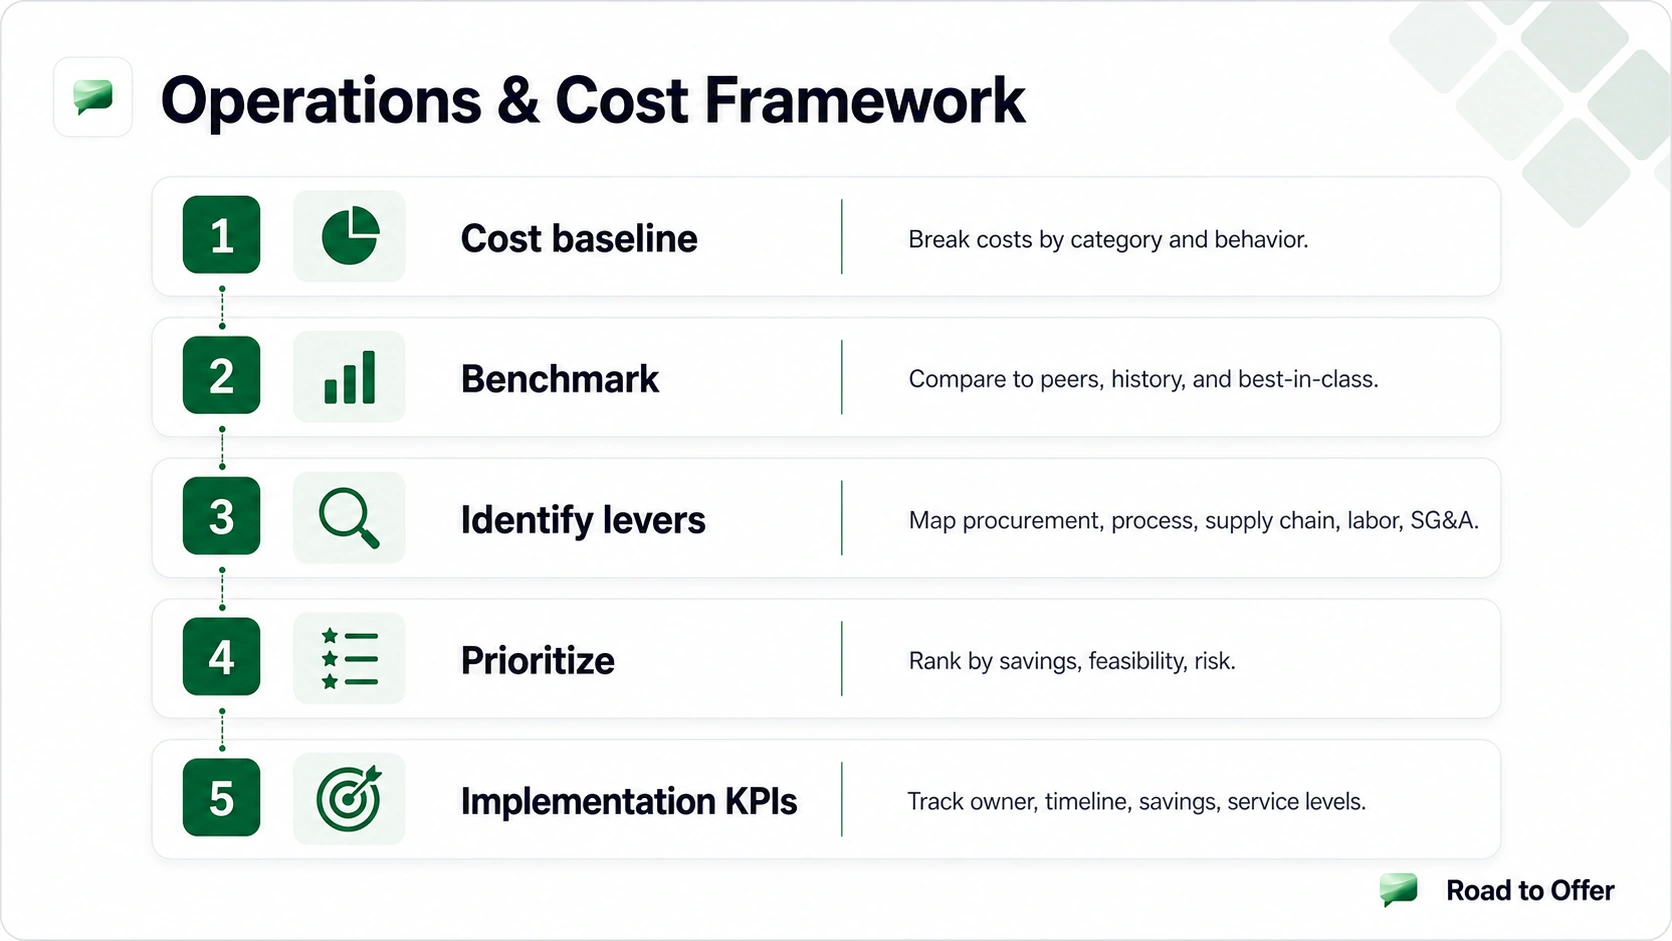
The 4-Step Method
Step 1: Map the cost base. Request a cost breakdown by category as a percentage of revenue. If total costs are $200M, quantify each bucket immediately: Procurement $80M (40%), Production $50M (25%), Distribution $30M (15%), SG&A $25M (12.5%), Overhead $15M (7.5%).
Step 2: Compare. Use interviewer-provided competitor data or the client's own historical performance. Do not import universal cost ratios across industries.
Step 3: Identify reduction levers. For each over-indexed category, propose specific levers and calculate savings from explicit case assumptions:
Step 4: Prioritize. Rank by impact (dollar savings), feasibility (execution difficulty), and speed (time to realize savings). Recommend the "high impact, high feasibility" initiatives first.
Worked Example: Manufacturing Cost Reduction
Prompt: An auto parts manufacturer has $400M revenue and 6% operating margin versus the 10% industry average. Close the gap.
Cost baseline and gaps:
Savings needed: $16M (from 6% to 10% margin on $400M)
Run the savings-gap calculation live from the Road to Offer drill engine: a real prompt, your answer, and AI-scored feedback. Free account includes free daily drills.
Recommendations:
- Procurement consolidation: Reduce from 23 steel suppliers to 8-10 with competitive bids. Savings: $16-19M. Timeline: 6-9 months.
- Production automation: $5M investment in robotic welding for 3 highest-volume lines. Savings: $6.4M/year (8% labor reduction). Payback: under 12 months.
- Energy optimization: Shift 40% of production to off-peak hours. Savings: $1.7M. Timeline: 3 months.
Total potential: $24-27M (exceeds $16M target, providing execution buffer). Sequence by speed: energy first (3 months), procurement second (6-9 months), automation third (12 months).
 Bain
BainOperations · medium
Practice a manufacturing cost case live
Close a margin gap under the same cost-tree method.
Worked Example: SaaS Cost Reduction
Prompt: A B2B SaaS company has $120M ARR and a -5% operating margin. The board wants profitability within 12 months.
Assume recognized revenue is $120M for this simplified case; otherwise do not use ARR as revenue.
Cost baseline and gaps versus the comparator ratios supplied in this worked example:
Minimum savings needed: $6M (from -$6M loss to breakeven)
Recommendations:
- Engineering rationalization: Pause 2 of 5 product initiatives serving less than 5% of customers. Reduce headcount 15% via attrition and selective layoffs. Savings: $6.3M minus $1.5M severance = $4.8M net year-1.
- Cloud optimization: For this example, assume reserved pricing and database right-sizing save $4.5M over 4 months. Validate the rate and eligible workload before using it in another case.
- G&A consolidation: Outsource payroll and basic accounting, reduce headcount 20%. Savings: $3.6M.
Total net year-1: $12-13M (2x the minimum). Do not cut customer success. If 12% annual churn rises even 2 points, that destroys $2.4M in recurring revenue.
To run the same cost-and-service tradeoff on a live prompt, work a distribution operations case where you map the cost base, find the bottleneck, and recover margin under a deadline.
 McKinsey
Operations · medium
Practice a live cost-recovery case
Retail Supply Chain / Operations
Common Traps
Advanced Levers
Zero-based budgeting (ZBB): Require every department to justify every dollar from zero, rather than adjusting last year's budget. Size any savings from the client's actual spend review rather than a universal band.
Shared services consolidation: Centralize finance, HR, and IT across business units, then calculate savings from duplicated roles, systems, and vendor contracts in the case.
Demand management: Reduce demand for internal services rather than cutting supply. Example: cutting financial reports from 47 to 12 saves more analyst time than hiring fewer analysts.
Related Guides
- Profitability Framework: cost reduction is one half of the profit equation
- Operations Cost Framework: deeper dive on supply chain and process optimization
- Value Chain Framework: maps cost leaks across the value chain
- Operations Case Interview: the broader archetype that cost reduction sits inside, covering efficiency, throughput, and service-level trade-offs
- Restructuring Case Interview: cost reduction is the core stabilization lever in distressed company cases; restructuring cases require sequencing the cost work correctly
- Alvarez & Marsal case interview guide: the turnaround and restructuring specialist whose cases live entirely in this cost-and-margin-recovery territory
- Break-Even Analysis Case Interview: every cost reduction case should model the break-even impact of the cuts on margin and volume
- Supply Chain Case Interview: map procurement, manufacturing, and logistics costs from the case's own cost base
- Kearney case interview guide: operations-heavy firm prep where procurement and implementation math show up often
- Roland Berger case interview guide: European automotive and industrial cases using the same margin-recovery mechanics
Master cost reduction cases before your interview
Road to Offer gives you full cost reduction cases with case-specific inputs, implementation timelines, and AI-scored recommendations.
Sources
- My Consulting Offer: Cost Reduction Case Interview (accessed March 20, 2026)
- Hacking the Case Interview: Cost Reduction Case Interview (accessed March 20, 2026)
- Highbridge Academy: Master Cost Reduction Cases (accessed March 20, 2026)
- My Consulting Coach: Implications of Cost Structure (accessed March 20, 2026)
- Roger Martin: Dangerous Cost Reduction Projects (accessed March 20, 2026)
- PrepLounge: Fixed & Variable Costs (accessed March 20, 2026)
Frequently asked questions
Resources and related guides
- Practice structure drillsPractice
- Browse all free resourcesResource hub
- Operations & Cost Optimization Framework for Case Interviews (2026)Frameworks · Feb 19, 2026
- Value Chain Framework for Case Interviews: Diagnose Margin Leaks FastFrameworks · Feb 6, 2026
- Profitability Framework: Formula, Steps & ExamplesFrameworks · Feb 3, 2026
- Customer Profitability Case Interview: Segmentation GuideFrameworks · Jun 3, 2026