McKinsey Redrock Study 2026: Format, Math, and Worked Answers
McKinsey Redrock Study is the data-interpretation exercise inside McKinsey Solve. Reported two-part format, Investigation-Analysis-Report flow, worked math examples, scoring caveats, and practical strategy. Confirm details from your McKinsey invitation.
On this page
McKinsey Redrock Study is the data-interpretation module of Solve; candidate reports commonly describe a roughly 35-minute Study flow (Investigation, Analysis, Report) plus six independent mini-cases, while your invitation remains the source of truth.
The reported timing and mini-case count come from MConsultingPrep, StrategyCase, PrepLounge, and Prepmatter, checked June 10, 2026. McKinsey's official Solve page describes Solve as a gamified assessment that showcases problem-solving ability and says performance is considered alongside the rest of your application and any other assessments you are asked to take. For the umbrella view of how Redrock fits into Solve, see our McKinsey Solve guide. This article focuses on Redrock-specific prep: the reported format, the math, the scoring caveats, and how to practice without treating unofficial details as guarantees.
What does Redrock Study test?
Redrock Study is the candidate-reported data-interpretation module associated with McKinsey Solve. The official assessment invitation controls the current format, while the transferable preparation job is chart reading, percentage logic, evidence checks, and a concise report.
Use the chart, math, implication method: 1. identify the chart question, 2. calculate with the correct denominator, 3. check the evidence, 4. state the business implication. An illustrative percentage example trains the skill, not an official Redrock answer key.
Redrock in five bullets
- What it is: the commonly reported data-interpretation module inside McKinsey Solve.
- Structure: Candidate reports describe a Study flow with Investigation → Analysis → Report, followed by independent mini-cases.
- Math focus: percentages, percentage points, growth rates, weighted averages (not advanced statistics).
- Pass bar: McKinsey does not publish one; treat high accuracy targets as practice goals only.
- Top fix: if your version includes calculator logging, use it to chain unrounded results across interdependent Study-style phases.
Build the skills Redrock tests
Drill data interpretation, weighted averages, and structured analysis with instant AI feedback before test day.
What Is the McKinsey Redrock Study?
Candidate reports place you in the role of a researcher analyzing fictional wildlife population data, often involving wolf packs and elk across geographic regions. The fictional context is useful for prep because it removes prior-knowledge advantage and forces pure data interpretation.
Some third-party prep providers report a roughly 35-minute Redrock flow and a shorter mini-case section in recent versions. Treat that as preparation context, not a promise: McKinsey can vary assessment details by role, region, and cycle, and your invitation should override any prep-site description.
The core skill being tested is reading a chart or table and pulling the right number under time pressure. That is exactly what a graph drill rehearses, so build the reflex before you sit the Study.
Read a Redrock chart under pressure from the Road to Offer drill engine: a real prompt, your answer, and AI-scored feedback. Free account includes free daily drills.
How Does Redrock Work? The Two-Part Structure
Candidate reports describe two distinct parts. The boundary between them is critical for time management if your invitation uses this version.
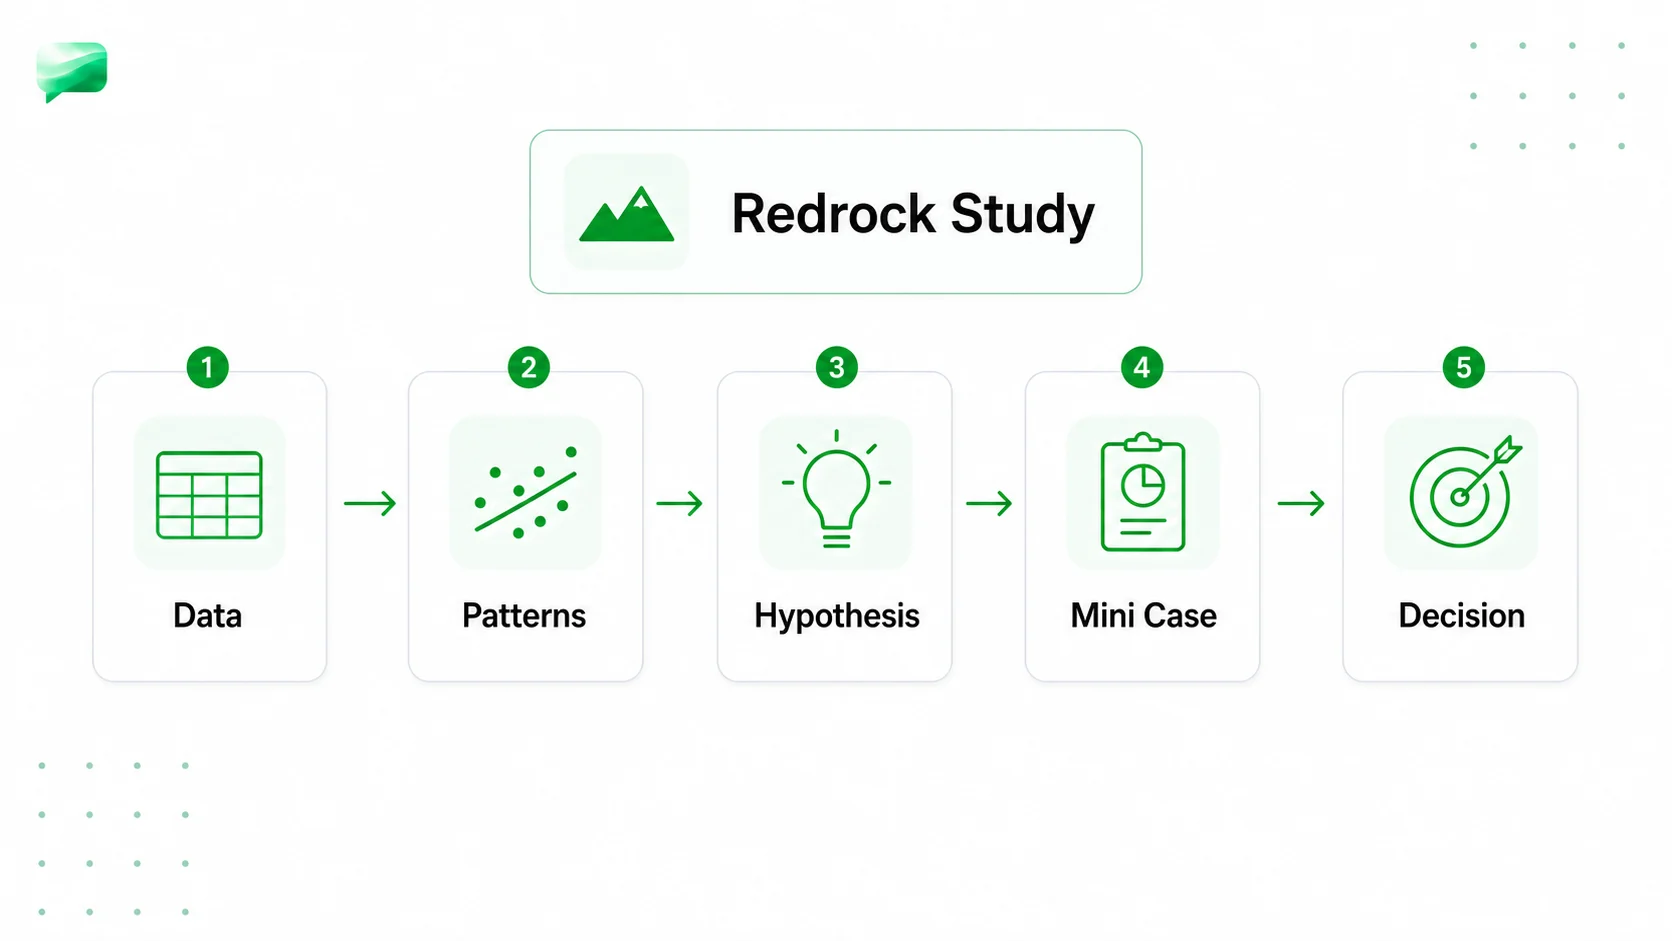
Part 1: The Study Section (Three Sequential Phases)
Candidate reports describe the three Study phases as one-directional. If your version works that way, once you advance you cannot return, so missed data in Investigation cannot be recovered during Analysis.
Phase 1: Investigation (practice target: ~5-7 min). You receive about a page of text plus charts and tables describing a research scenario. You drag relevant data points into a Research Journal. The discipline: read the research objective first, identify which calculations Analysis will require, and only collect the data points those calculations need. Candidates who grab every number end up with a cluttered Journal and slower Analysis.
Phase 2: Analysis (practice target: ~8-10 min). You answer math questions using the data you collected. Some candidate reports describe an on-screen calculator that logs unrounded results and lets you reuse those values. If present, this feature is a major accuracy lever because manual re-entry of rounded numbers creates cascading errors.
Phase 3: Report (practice target: ~5-7 min). You fill in a partially completed research report: numeric blanks, directional comparisons ("higher" vs. "lower"), and chart-type selection. If your Analysis answers were wrong, the Report fill-ins can propagate the error.
Part 2: The Cases Section (Six Independent Mini-Cases)
After the Study, candidate reports describe a set of standalone mini-cases. Each case is self-contained, so an error on one does not necessarily affect the others. This breaks the cascading-error problem of Part 1 and lets you recover from individual mistakes. In practice, aim for high accuracy across the set rather than chasing a published pass line.
What Math Does Redrock Test?
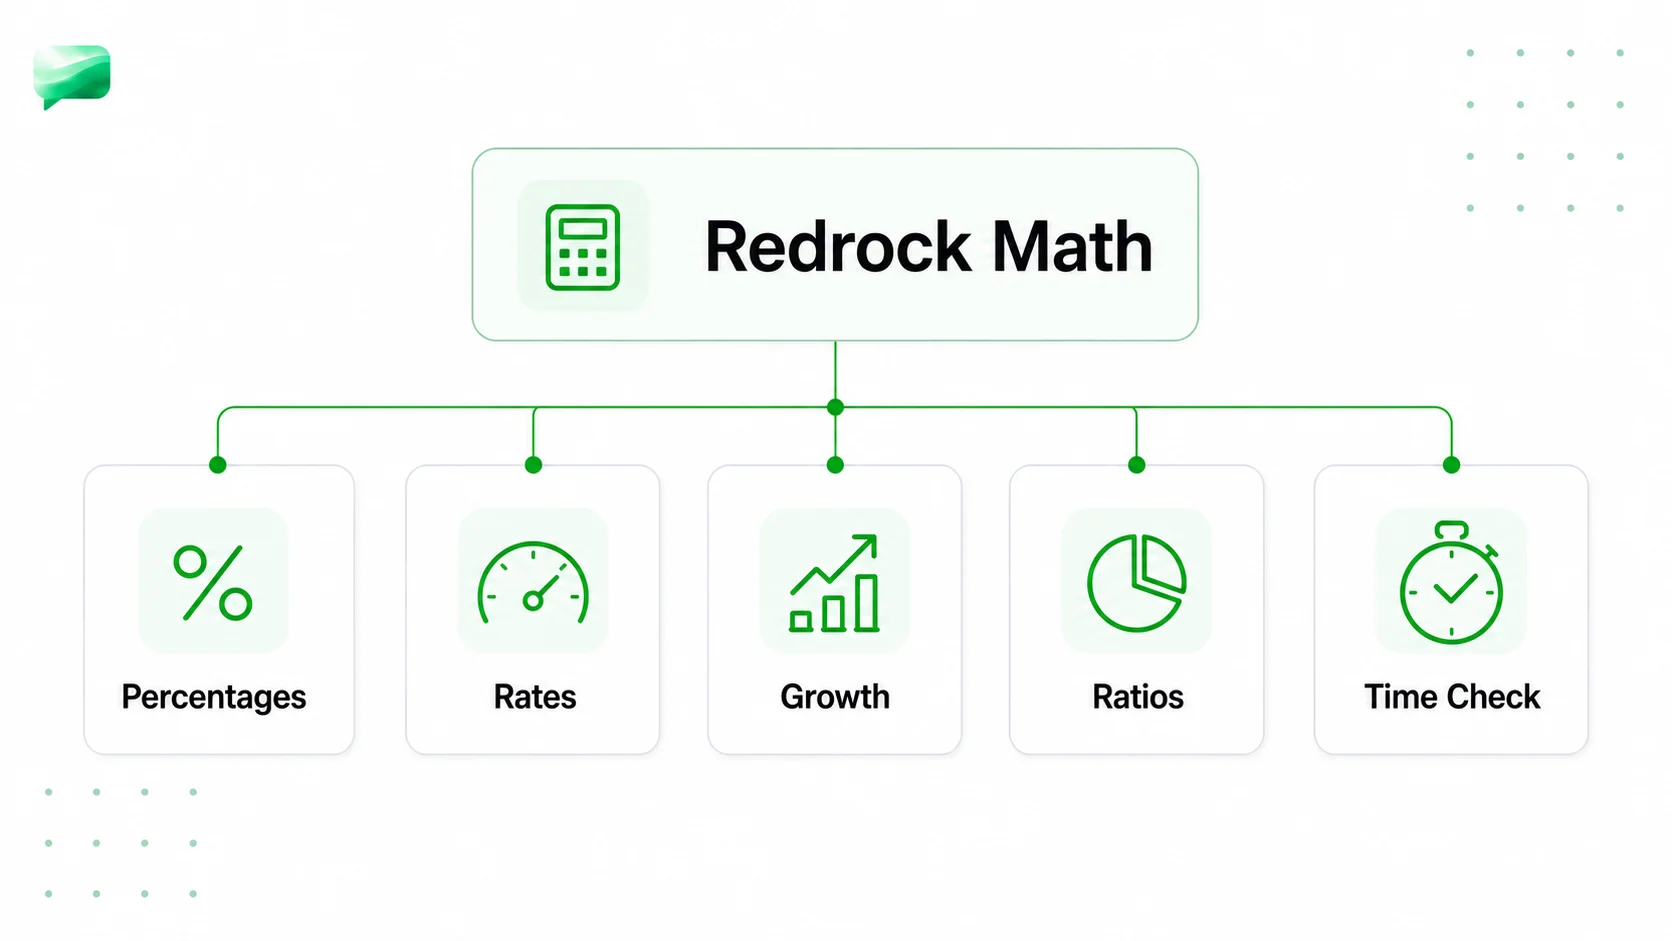
Candidate reports suggest Redrock is math-heavy. The math is not advanced, but it must be fast and accurate under time pressure. Build automatic fluency with five concept areas:
Worked Example: Growth Rate Comparison (Analysis Phase)
Scenario: Compare wolf population growth in the Northern vs. Southern Region (Year 1 to Year 5). Northern: 240 → 312. Southern: 180 → 216.
- Northern growth rate: (312 − 240) / 240 × 100% = 30%
- Southern growth rate: (216 − 180) / 180 × 100% = 20%
- Difference: 10 percentage points (not 10%, not 33%)
If your version includes calculator logging, save both rates before computing the difference. If a follow-up question asks for the pooled growth rate across both regions, you will need the unrounded values to avoid compounding errors into the Report phase.
Worked Example: Weighted Average (Analysis Phase)
Scenario: Calculate the island-wide wolf density weighted by territory.
- Weighted (correct): (480 + 360 + 240) / (120 + 180 + 60) = 1,080 / 360 = 3.0 wolves/km²
- Simple average (incorrect for "island-wide"): (4.0 + 2.0 + 4.0) / 3 = 3.33
Read the question phrasing carefully. "Average density across the island" requires the weighted method. "Average of the three regional densities" requires the simple method. Picking the wrong one is the single highest-frequency conceptual error in this question type.
These growth-rate and weighted-average steps are the same arithmetic case interviews demand, just under a research wrapper. A timed math drill is the fastest way to make them automatic.
Drill case math under time from the Road to Offer drill engine: a real prompt, your answer, and AI-scored feedback. Free account includes free daily drills.
How Is Redrock Scored?
McKinsey does not publish a Redrock scoring matrix. Candidate reports and third-party prep discussions point to two useful practice dimensions.
Answer accuracy: straightforward correctness. Analysis answers matter because errors can cascade into Report. Use 80-85% accuracy and near-complete mini-case correctness as practice targets, not as official thresholds.
Process quality: assume the platform can observe your interaction pattern, including how you collect data, use the calculator, revise answers, and distribute time. Even when the exact scoring model is not public, a cleaner process reduces avoidable errors.
A clean practice profile looks like targeted Investigation notes, calculator logging on every multi-step calculation, deliberate chart selection, and few rushed reversals. Do not confuse this with an official scoring formula.
How Do I Prepare for Redrock?
A 5-step preparation sequence based on what successful candidates report on PrepLounge, MConsultingPrep, and StrategyCase:
- Build math fluency (Days 1-3). Drill percentages vs. percentage points, weighted averages, and growth rates until automatic. Our case interview math practice guide covers these exact operations.
- Memorize chart-type decision rules (Day 2-4). Bar = compare categories at one time point. Line = trend over time. Stacked bar = composition over time. Scatter = correlation. Pie = parts of a single whole. Histogram = distribution of one variable. Treat Report-phase chart selection as high-stakes in practice.
- Practice chart interpretation (Days 3-5). Give yourself 60 seconds per chart to extract the trend, outlier, and what the data does not show. Builds the rapid-assessment habit Redrock requires.
- Run timed simulations and Road to Offer drill reps (Days 5-10). Use third-party simulations for Redrock-like pacing, then use Road to Offer graph and math drills to repair the exact error type: exhibit reads, weighted averages, growth rates, and synthesis from data. Then bridge into live McKinsey practice cases so Redrock data habits show up in interviews.
- Review errors by category (ongoing). Math error → more drilling. Misread question → practice reading the question before the data. Chart error → revisit decision rules. Time blowup → adjust your phase budget.
Run Redrock-style reps with instant feedback
Practice data interpretation, weighted averages, and growth rates in timed drills and full cases, then fix the exact error type the AI flags.
Common Redrock Mistakes (and Fixes)
The six errors that most often damage Redrock-style practice:
Time Management: A Reported 35-Minute Practice Budget
As a practice rule, allocate roughly two-thirds of your time to the Study flow and one-third to the independent mini-cases. If you fall behind: stop collecting in Investigation, advance with what you have, and never skip a mini-case if the interface allows an educated answer.
Connected Resources
Redrock is one piece of McKinsey's screening process. Pair this guide with:
- McKinsey Solve guide: umbrella view of both modules and the dual scoring system
- McKinsey Sea Wolf guide: the commonly reported ecosystem-style Solve module
- McKinsey case interview guide: the live interview round Solve gates you toward
- McKinsey PEI guide: the behavioral component of the live round
- Consulting aptitude test overview: how Redrock fits the broader firm assessment landscape across McKinsey, BCG, and Bain
Clearing Solve gets you to the live round. Rehearse the kind of McKinsey case that round opens with.
 McKinsey
Profitability · medium
Practice a McKinsey first-round profitability case
Energy / Retail
Sources and Further Reading (checked 2026-06-10)
- McKinsey careers, interviewing: https://www.mckinsey.com/careers/interviewing
- McKinsey careers, Solve assessment: https://www.mckinsey.com/careers/mckinsey-digital-assessment
- MConsultingPrep, Redrock deep dive: https://mconsultingprep.com/mckinsey-solve-redrock-deep-dive
- IGotAnOffer, McKinsey Solve guide: https://igotanoffer.com/blogs/mckinsey-case-interview-blog/mckinsey-problem-solving-game
- StrategyCase, Redrock guide: https://strategycase.com/mckinsey-solve-game-red-rock-study/
- PrepLounge, McKinsey Solve forum: https://www.preplounge.com/consulting-forum/mckinsey-solve-redrock-study-15645
- Prepmatter, 2026 Solve update: https://prepmatter.com/blog/whats-new-in-mckinsey-solve-2025
Frequently asked questions
Resources and related guides
- Run a real case interviewPractice
- Browse all free resourcesResource hub
- McKinsey Redrock Study 2026: formato, matemáticas y respuestas trabajadasFirm Specific · Mar 1, 2026
- McKinsey Redrock Study 2026 : format, calculs et réponses expliquéesFirm Specific · Mar 1, 2026
- McKinsey Sea Wolf Game: Rules, Scoring, and StrategyFirm Specific · Mar 1, 2026
- McKinsey Ecosystem Building: Strategy, Status, and What Replaced ItFirm Specific · Mar 7, 2026