
Consumer Goods Case Interview: CPG Frameworks & Examples
Consumer goods case interview guide: sell-in vs sell-through, CPG archetypes, RGM and trade-spend vocabulary, and worked examples.
On this page
A consumer goods case interview asks you to explain performance from the shopper through the retailer to the manufacturer. Separate sell-in from sell-through, then test distribution, sales velocity, price, trade spend, and product cost. Use a profitability tree that reflects those drivers before recommending a price, promotion, distribution, or portfolio change.
What Makes a CPG Case Different: Consumer-First Thinking and Sell-In vs Sell-Through
The reason a CPG case is intuitive is also the reason candidates underperform on it. Everyone understands buying a product off a shelf, so the business model feels simple. That comfort makes people skip the one move that separates a strong CPG answer from a generic profitability answer: reasoning from the consumer first, then translating that into the company's data.
The single most important concept is the sell-in vs sell-through split.
- Sell-in is the volume a brand ships into its retail customers. Revenue recognition depends on the sales contract and transfer of control, not simply the date an order is placed.
- Sell-through is what end consumers actually buy off the shelf.
These two numbers diverge constantly, and the gap is where the insight lives. A brand can report a great quarter on sell-in by loading retailers with inventory, while sell-through quietly declines. That shows up later as bloated retailer stock, canceled reorders, and trade-promotion markdowns. So when a CPG case hands you "sales are up but profit is down," your first instinct should be: are we looking at sell-in or sell-through, and what is the shopper actually doing?
This is why CPG cases split the world into two customers. The brand sells to the trade (retailers, who have their own margin and shelf-space agenda) and to the shopper (the end consumer, who decides at the shelf). A good answer keeps both in view and never confuses one for the other.
Practice a CPG case with instant AI feedback
Practice a snack-business profitability decision with AI feedback. The case is a broader transfer exercise, not a replay of this article exhibit.
The CPG Profitability Tree: Revenue, Costs, and "Where Did the Profits Go"
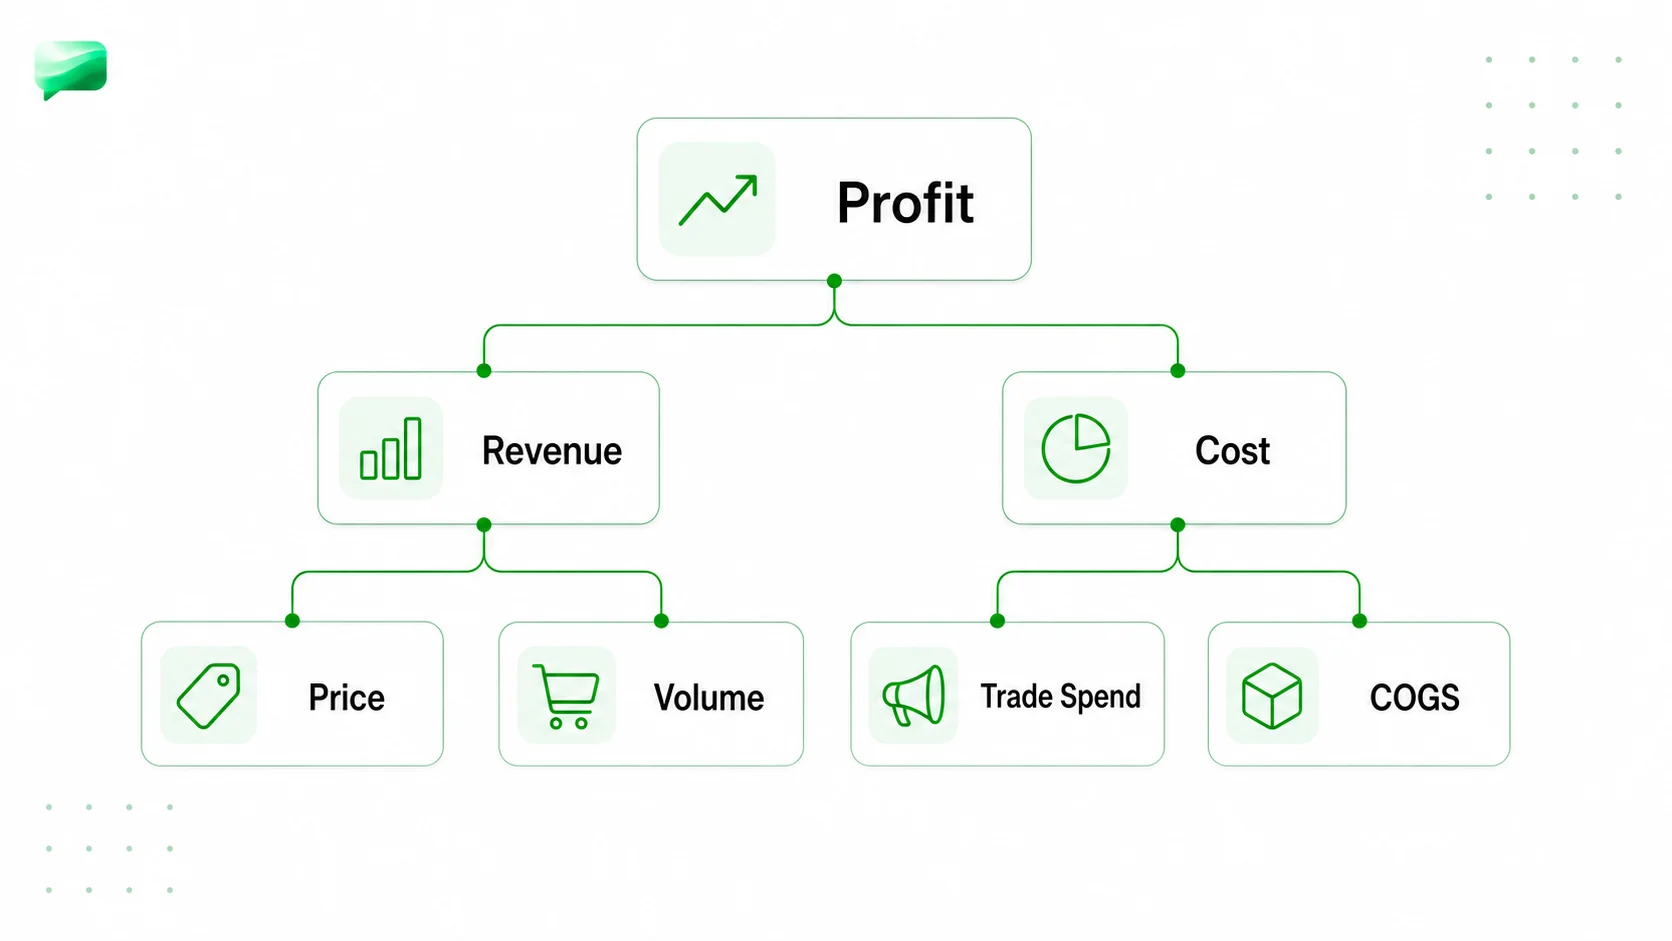
Most CPG cases reduce to a profit equation, but the segmentation is CPG-specific. You break revenue down by the variables that actually move in this industry: segment, channel, brand, and pack size.
Revenue = units x price per unit, segmented by:
- Channel (mass retail, grocery, drugstore, online, DTC)
- Brand or segment (premium vs value, flagship vs sub-brands)
- Pack or SKU (large vs small format, multipacks)
Costs = fixed + variable, where variable costs are dominated by COGS (ingredients, packaging, manufacturing) and the CPG-specific line that trips up generalists: trade spend (money paid to retailers for promotions, displays, and shelf space), which behaves like a cost but is often booked as a deduction from revenue.
Which CPG Metrics Explain the Change?
NIQ defines velocity as sales per distribution point, checked September 5, 2026. Numeric distribution and sales-weighted distribution use different denominators; do not treat them as interchangeable.
Worked Exhibit: More Stores, Weaker Shelf Demand
Given, RTO teaching inputs: A snack brand expands within a 2,000-store market. Each period lasts four weeks. Every listed store stocks the product throughout its period. There are no returns, losses, or inventory transfers. Manufacturer net price is $2 per shipped pack, after trade spend; variable product cost is $1.20. These are teaching assumptions, not actual company results.
Before reading on, calculate velocity and closing inventory. Does the expansion demonstrate stronger shopper demand?
Velocity: Period 1 = 100,000 / 1,000 / 4 = 25 packs/store/week. Period 2 = 108,000 / 1,200 / 4 = 22.5. Distribution rises from 50% to 60%, but velocity falls 10%. Aggregate sell-through rises 8%, which does not prove stronger demand at comparable stores.
Inventory: Period 2 closing stock = 20,000 + 132,000 - 108,000 = 44,000 packs. Sell-in rises 32% while sell-through rises only 8%. The difference accumulates on the retailer's shelves.
Manufacturer contribution on shipments: Period 1 = 100,000 x ($2 - $1.20) = $80,000. Period 2 = 132,000 x $0.80 = $105,600, before fixed costs. That increase is not proof of sustainable demand; future orders may fall as retailers work down inventory. Trade spend is already deducted from net price, so do not subtract it twice.
Recommendation: Separate new stores from existing stores before expanding further. Check availability, promotion timing, and same-store velocity. Reconcile retailer inventory with reorders. A further distribution rollout is premature if weak shelf demand is hidden by initial stocking.
Use the charts and graphs method to practice turning comparisons into implications, then try a graph drill. The drill supplies a fresh exhibit, not this snack-brand table.
The 5 Most Common CPG Case Archetypes
Use these archetypes to generate hypotheses, not to substitute for the client objective.
1. Pricing / Revenue Growth Management (RGM). The client wants to grow revenue without losing volume. You work price, pack architecture, mix, and promotion. RGM is the modern CPG name for this discipline, and naming it signals you know the industry. See the pricing strategy cases guide for the deeper pricing toolkit.
2. New-Product Launch and Market Entry. Should the client launch a new product or enter a new segment? You size the opportunity (population x usage x share x margin) and weigh launch economics against cannibalization. This leans on the market entry framework.
3. Supply-Chain / Operations Cost Reduction. The client needs to cut cost of goods or logistics cost. RocketBlocks frames its "Sweet Opportunity" operations case around a Fortune 100 packaged-beverage company running nearly 4,000 products across 1,000 manufacturing facilities worldwide, the kind of scale where SKU rationalization and network optimization create real savings.
4. Brand Portfolio and Market-Share Strategy. The client is losing share or defending a flagship brand against a competitor's premium launch. You decide where to allocate marketing dollars and whether to defend, reposition, or prune.
5. M&A / Acquisition Due Diligence. Should the client (or a PE buyer) acquire a brand? In one ConsultingCase101 example, a Mars & Co private-equity case features acquirer Cerberus Capital Management with USD $40 billion under management, evaluating a CPG target. You assess market attractiveness, target quality, and synergies.
CPG-Tailored Frameworks: 3 C's, 4 P's, and Three Pricing Lenses
Generic frameworks work in CPG only if you bend them toward the consumer and the shelf.
The 3 C's (Company, Customers, Competitors). In CPG, "customers" is deliberately ambiguous, so split it: the trade (retailers) and the shopper (end consumer). Competitors include both branded rivals and private label (the retailer's own-brand product), which is a structural threat, not a footnote.
The 4 P's (Product, Price, Promotion, Placement). This is the marketing-mix lens that fits CPG better than a bare profitability tree. "Placement" maps directly to channel and shelf position; "Promotion" maps to trade spend and consumer marketing.
The three pricing lenses. When pricing comes up, evaluate all three:
- Cost-based (cost plus a target margin)
- Value-based (what the consumer is willing to pay for the benefit)
- Competitor-based (priced against rivals and private label on the shelf)
The strongest answers triangulate across all three rather than defaulting to cost-plus.

Profitability · medium
Try a free live consumer goods case interview
Matched to this consumer goods guide: a live consumer packaged goods profitability case with an AI interviewer. Free, scored on every step.
Worked Example 1: New-Product Launch Sizing
This is the launch-sizing calculation, modeled on ZS's published consumer goods practice case, where the existing Product A (Summertime Sunscreen) holds 2% of the U.S. sunscreen market.
Prompt: The client is launching a new sunscreen line and wants to size the annual contribution before launch costs from one target segment: men aged 18 to 29.
The structure: population x usage rate x target share x per-unit margin.
Step 1. Population. The men 18 to 29 segment is 27 million people.
Step 2. Usage rate. 26% are regular sunscreen users, so the addressable user base is 27M x 26% = about 7 million regular users.
Step 3. Target market share. At a projected 2% share (consistent with the existing brand's 2% sunscreen-market position), buyers = 7M x 2% = about 140,000 buyers.
Step 4. Per-unit margin. Price is $24.99 and variable cost is $9.99, so margin per unit = $24.99 - $9.99 = $15 per unit.
Step 5. Annual contribution. Assuming one unit per buyer per year, 140,000 buyers x $15 = about $2.1 million annual contribution before fixed launch costs, trade deductions, and cannibalization. Those omitted inputs are needed to estimate operating profit.
The consumer-first move: do not stop at the math. The same case notes that nonbinary users aged 18 to 29 are 25% frequent sunscreen users, a near-identical usage rate to men. A strong candidate flags that adjacent segments with similar usage can be layered in to scale the launch, and asks which segments the brand can reach with the same channel and creative.
How Do You Turn a Profit Decline Into a Testable Diagnosis?
Use the exhibit above to separate three hypotheses: distribution is insufficient, shelf demand is weakening, or manufacturer net price is falling. Ask for a same-store split, promotion history, and trade deductions before choosing a fix. Customer profitability helps when servicing particular accounts erases the benefit of their sales.
A useful recommendation names the driver and a test: "Pause expansion until we understand the 10% velocity decline. Compare repeat stores with new stores, then test availability and promotion changes before buying more distribution." This conclusion is provisional because the aggregate exhibit cannot isolate those causes.
Channel and Retailer Dynamics: Private Label, DTC, and Trade Spend
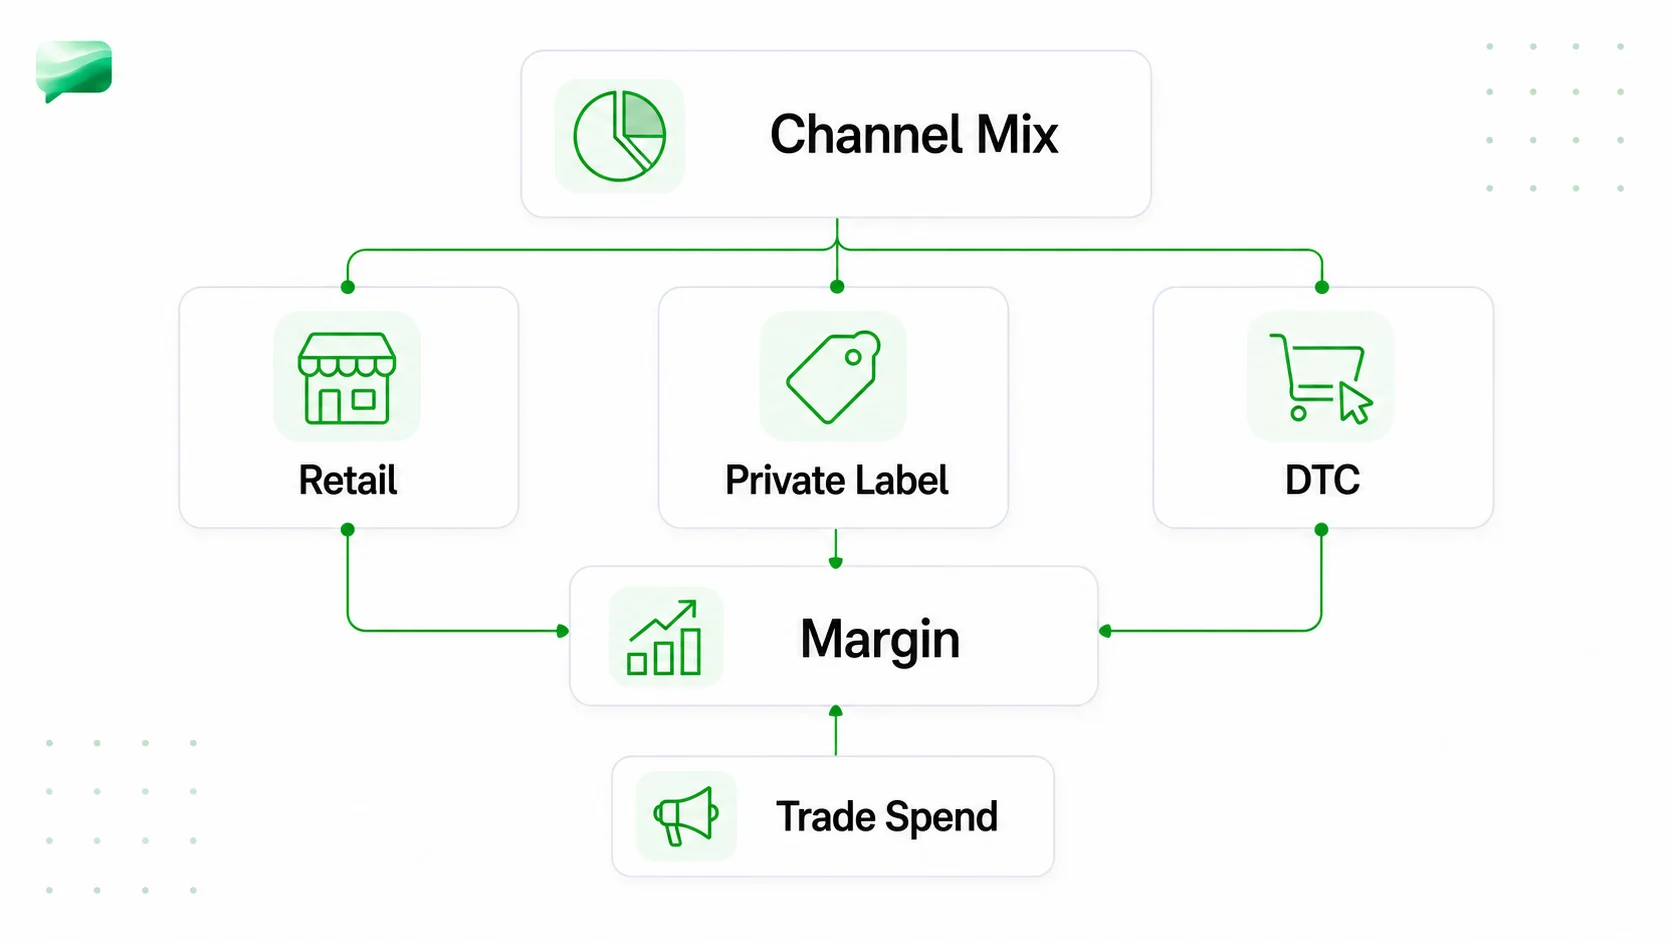
CPG strategy is downstream of the shelf, so channel dynamics show up in almost every case.
Private-label threat. Retailers sell their own-brand versions at lower prices and control the shelf. When a brand loses share, private label is a prime suspect, and the defense is rarely "match the price." It is usually differentiation, innovation, or pack/price architecture that protects the premium.
Retailer / buyer power. A handful of large retailers can account for most of a brand's volume, which gives them leverage on price, terms, and shelf space. That power is why trade spend exists and why it is so hard to cut.
Trade promotion / trade spend. This is money the brand pays retailers for promotions, displays, and listings. It can quietly consume a large slice of gross margin, and a common turnaround lever is making trade spend more efficient (fewer, deeper, better-targeted promotions) rather than across-the-board cuts.
The DTC decision. Going direct-to-consumer captures retailer margin and first-party data, but it adds fulfillment cost and channel conflict with the retailers who still drive most volume. Treat DTC as a tradeoff, not a default yes. For the retail-side mechanics of shelf, footfall, and basket economics, see the retail case interview guide.
Brand Portfolio and Market-Share Strategy
When the prompt is "we are losing share" or "a competitor just launched a premium product," you are in portfolio territory.
The core questions: Which brands earn the marketing dollars? Do you defend the flagship, reposition a weak brand, or prune it via SKU rationalization? When a rival launches a premium product, options range from a fighter brand, to a premium line extension of your own, to holding position and defending distribution.
The deciding lens is always the consumer: who is switching, to what, and why. If shoppers are trading up to premium, a value-only defense loses. If they are trading down to private label in a recession, premium innovation will not stop the bleed. Allocate marketing dollars toward the segments and brands with the best margin-weighted growth, not the loudest internal advocate.
Industry Knowledge: Top Firms, Terminology, and CPG Metrics
A little fluency signals you belong in the room.
Firms and clients. CPG is core work for MBB and the strategy arms of the Big Four, plus specialists. The named prompts you will see in practice material reflect real client scale: RocketBlocks' Fortune 100 beverage giant with nearly 4,000 products, and PE-backed deals like the Mars & Co case where Cerberus manages USD $40 billion. ConsultingCase101 also references Johnson & Johnson as No. 37 on the 2018 Fortune 500 in a CPG loyalty-program case, a reminder of how large these clients are.
Vocabulary that earns credibility:
- RGM (Revenue Growth Management): optimizing price, pack, mix, and promotion together.
- Sell-through: what shoppers buy off the shelf (vs sell-in to retailers).
- Trade spend: payments to retailers for promotion and shelf space.
- Private label: retailer own-brand competitor.
- DTC: direct-to-consumer.
- SKU rationalization: cutting underperforming products to simplify the portfolio.
Metrics interviewers expect you to reach for: volume vs value share, price per unit and price/mix, gross margin and contribution margin, trade spend as a percent of revenue, and distribution or shelf metrics.
How to Practice CPG Cases
The fastest improvement comes from reps on the two worked-example shapes above, not from reading more frameworks.
- Drill both calculation patterns. Launch sizing (population x usage x share x margin) and P&L decomposition ("where did the profits go") cover most CPG math. Time them.
- Avoid the number-one pitfall. Framework-dumping a generic profitability tree without a consumer insight is the most common failure. Lead with the shopper, then attach the data.
- Build CPG vocabulary into your speech. Saying "let me check sell-through versus sell-in" or "how much of margin is trade spend" lands very differently from a generic profit tree.
- Get volume and feedback. Run enough cases that recognizing the archetype is automatic, and use feedback to catch when you slid into framework recall.
Run a CPG case before your interview
Practice the GreenBite profitability case with AI training feedback, then review how you separated revenue and cost drivers.
Learn the Method Before Your Next Full Case
Learn how to structure a business case
Use the how-to-case lesson before the GreenBite Voice case. Transfer the habit of separating drivers; do not expect the same exhibit.
Sources (checked June 26, 2026)
- ZS Careers, consumer goods practice case (sunscreen launch sizing): https://www.zs.com/careers/interview-process/case-interview-practice/practice-case-three
- RocketBlocks, CPG operations case ("Sweet Opportunity")
- ConsultingCase101, household goods and consumer products cases
- PrepLounge, Bain "BeautyCo: Where Did the Profits Go?" case
Frequently asked questions
Resources and related guides
- Try a free live consumer goods case interviewPractice
- Browse all free resourcesResource hub
- Automotive Case Interview: Value Chain, Examples & PrepFundamentals · Jun 30, 2026
- Banking Case Interview: Framework, Examples & PrepFundamentals · Jun 30, 2026
- Insurance Case Interview: Framework, Ratios & ExampleFundamentals · Jun 30, 2026