Profitability Framework: Formula, Steps & Examples
Use the profitability framework for case interviews: Profit = Revenue - Costs, price x volume, fixed/variable costs, root-cause bridge, and examples.
On this page
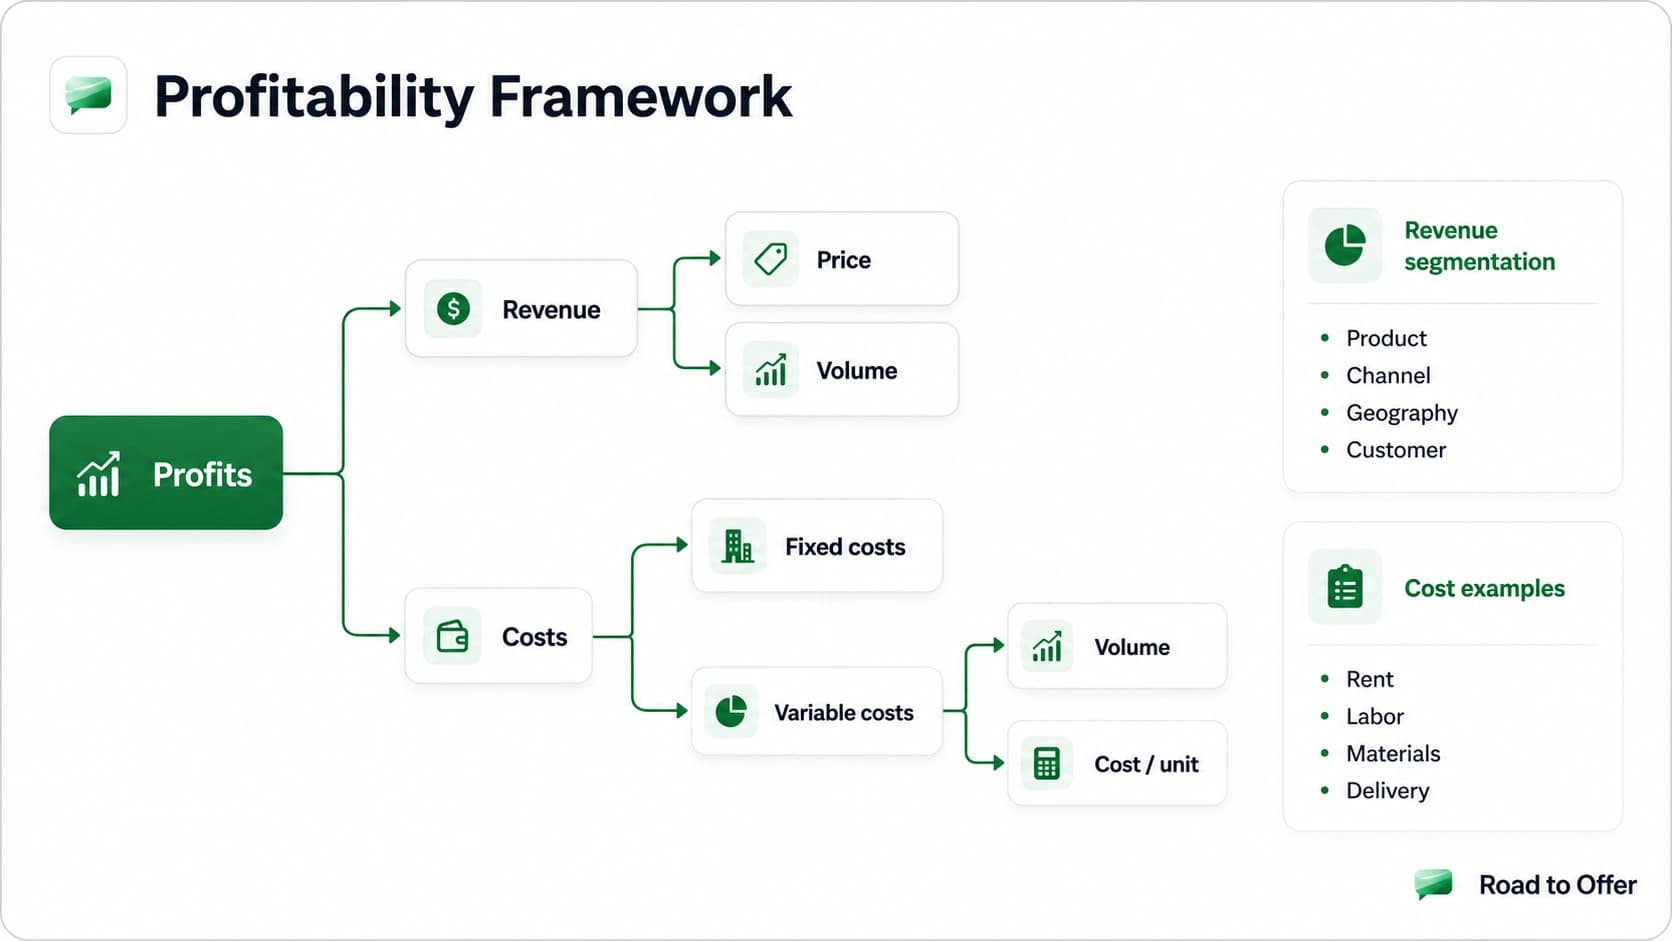
The profitability framework starts with Profit = Revenue - Costs. In a case interview, split Revenue into Price x Volume, split Costs into Fixed + Variable, then compare each branch against the baseline to find why profit changed.

Profitability Framework Formula and Steps
Use this structure for profit decline, margin compression, or profit improvement cases. The top-level formula stays stable, but the sub-branches should adapt to product, customer, channel, geography, and industry economics.
Run One Profitability Structure Drill
Profitability cases start with the tree: revenue, cost, variance driver, and first test. Run one short structure rep below, then use targeted drills if this step feels slow.
Profit Decomposition Tree
- Profit = Revenue - Costs
- Revenue = Price x Volume
- Price: list price, discounts, fees, product mix
- Volume: customers, transactions, units per customer, churn
- Costs = Fixed Costs + Variable Costs
- Fixed costs: rent, overhead, contracts, base payroll
- Variable costs: materials, direct labor, logistics, commissions
- Segment the tree by product, customer, channel, or geography when averages hide the root cause.
When the cost side dominates, a driver tree that maps every cost line to its operational input variables helps you isolate the exact lever responsible for the decline rather than hunting through aggregates. For cases where the cost issue is primarily operational, the operations cost framework gives a more granular lens on process inefficiency.
Case Prep Playbook
Learn profitability cases
The profit tree on a real case arc: localize, quantify, recommend.
Step 1: Clarify the Profit Problem
Before the tree, align on definitions:
- Which metric: gross profit, operating profit, EBITDA, or net income?
- Which period: YoY, quarter-over-quarter, or rolling 12 months?
- Absolute decline or margin compression?
- Company-specific issue or industry-wide shift?
This prevents false diagnoses.
Step 2: Build the Revenue Tree
Start with:
- Revenue = Price x Volume
Then segment revenue by the dimensions that matter most for this case:
- Product line
- Customer segment
- Channel
- Geography
Fast diagnostic logic
- If revenue is down and costs are flat -> likely demand/pricing issue.
- If revenue is flat and profits are down -> likely cost or mix issue.
- If revenue is up but profits still down -> likely poor incremental margin / cost-to-serve.
Segment revenue before you conclude
Averages hide the problem. Once you have Revenue = Price x Volume, segment each side by the dimension that matters for this business:
- Product line: premium vs entry-level, core vs accessories
- Customer type: enterprise vs SMB, new vs returning, B2B vs B2C
- Channel: owned DTC vs marketplace vs wholesale vs retail
- Geography: mature vs emerging markets
A revenue line that looks flat in aggregate often hides a damaging mix shift: high-margin enterprise customers churning while low-margin SMB volume grows. Total revenue holds, profit falls. That mix effect is one of the most common reasons a profitability case is not a simple "sales went down" story, and it sits at the heart of a worked airline profitability case, where falling route yields hide behind steady passenger counts.
Revenue equations adapt to the business model
The Price x Volume skeleton holds, but the actual revenue equation depends on how the company makes money. Recognize the model in the first minute and your math stays clean:
Pick the wrong equation and every downstream number is wrong, so confirm the model before you size anything.
Step 3: Build the Cost Tree
Split costs into:
- Fixed costs: rent, HQ overhead, long-term contracts, base payroll
- Variable costs: materials, direct labor, logistics, commissions
Then test what moved and why:
- unit cost inflation?
- volume dilution of fixed cost absorption?
- operating inefficiency?
- channel mix shift toward high-cost routes?
Break costs to the line item, then benchmark
Fixed vs variable is the first cut, not the answer. Once you know which side moved, drill to the line item and compare against a baseline:
- Variable costs: Variable cost = units x cost per unit. A 10% rise in cost per unit points to suppliers, input prices, yield and waste, or a richer product spec. Isolate which one.
- Fixed costs: rent, salaries, infrastructure, long-term contracts. A fixed-cost jump usually traces to a specific decision: new facilities, a hiring wave, or a sunk investment that has not yet earned its keep.
- Benchmark, do not guess: ask how each cost line moved over the last few quarters and how it compares to peers. Lines that scaled faster than revenue, or sit above industry norm, are your candidates.
Watch the absorption trap: if volume fell, the same fixed base now spreads over fewer units, so unit economics worsen even though nothing actually got more expensive. That looks like a cost problem but the root cause is volume.
Step 4: Isolate Root Cause with a Margin Bridge
Use a compact bridge logic:
- Start from prior-year profit.
- Attribute variance to price, volume, mix, and cost buckets.
- Identify top 1-2 drivers responsible for most decline.
Example margin bridge (simplified)
Find the Qualitative Root Cause: the 4Cs
The margin bridge tells you WHAT moved. It does not tell you WHY, and "why" is what earns the offer. Once you have isolated the top one or two drivers, switch from arithmetic to business judgment. The 4Cs keep that search structured:
- Customer: have needs, willingness to pay, or buying behavior shifted? Is a segment churning?
- Company: did an internal change (strategy, pricing policy, operations, a launch) precede the drop?
- Competitor: did a rival cut price, launch a substitute, or take share?
- Context: did the market move, regulation change, or an input cost spike industry-wide?
The strongest candidates connect each quantitative driver to a 4Cs cause and a matching lever. "Price fell 14% in the online channel" (what) becomes "to match marketplace sellers after a new competitor entered" (why) becomes "tighten discount policy and re-anchor on value rather than match dollar for dollar" (lever). Across Road to Offer practice cases, candidates who narrate that what-why-lever chain out loud score noticeably higher on the recommendation dimension than those who stop at the number.
Step 5: Recommend Levers and Quantify Impact
Strong recommendations include:
- What to do now (2-3 actions)
- Expected impact (order-of-magnitude numbers)
- Execution risk + mitigation
- KPIs to track in first 90 days
Typical levers by root cause
For a dedicated treatment of cost-side levers, see the cost reduction case interview guide. When a volume decline is driving the profit drop and the root cause looks like customer-level economics rather than pricing or channel mix, layer in unit economics framework analysis to check whether individual customer acquisition costs and lifetime value are still in balance. In subscription or recurring-revenue businesses, the customer lifetime value framework adds a forward-looking lens: if CLV is falling even as volume holds, the margin problem will compound over time.
Visual Math: Margin Recovery Intuition
If you need to recover 12% on a $250M base, that's $30M. Split a 12% target into three or four discrete levers, each 3-4% (≈ $7.5-10M each), and the math becomes manageable under interview pressure with a built-in sanity check.
Worked Example (End-to-End)
Case prompt: A mid-size consumer electronics brand saw operating margins drop from 18% to 11% over two years despite stable revenue of $850M. The CEO wants to know why and what to do about it.
A. Diagnose quickly
- Revenue stable at ~$850M, so this is not a demand problem
- Operating profit fell from $153M (18%) to $93.5M (11%), a $59.5M decline
- Variable costs rose from 55% to 60% of revenue (+$42.5M)
- Fixed costs increased from $230M to $255M (+$25M), partly offset by minor SG&A savings (-$8M)
B. Root cause hypothesis
- Price erosion in the direct-to-consumer online channel (aggressive discounting to match marketplace sellers)
- Product mix shifted toward lower-margin accessories and entry-level SKUs
- Input cost inflation on semiconductor components (industry-wide, but competitors hedged earlier)
C. Quantified actions
- Tighten online discount policy by 3 pp on top 20 SKUs -> +$15M
- Rebalance channel mix: shift 8% of volume from marketplace to owned DTC -> +$12M
- Dual-source semiconductor supply and renegotiate primary contract -> +$18M
- Rationalize 15% of low-margin accessory SKUs -> +$8M
Total modeled recovery: +$53M (closes ~89% of the gap; remaining $6.5M addressed through operating leverage as mix improves).
D. Recommendation statement
"I recommend a 3-quarter margin recovery program focused on pricing discipline in the online channel, DTC mix correction, input-cost renegotiation, and SKU rationalization. These four levers can recover roughly $53M of the $59.5M decline. The primary risk is volume elasticity from tighter discounting. I'd pilot pricing changes in two regions before full rollout and track weekly sell-through to catch demand shifts early."

Profitability · easy
Practice a live profitability case
CPG / Packaged Snacks
Common Failure Modes
- Overly broad framework with no prioritization.
- No baseline comparison (before vs after, client vs peer).
- Math without business meaning (correct numbers, weak implication).
- Recommendation without impact sizing.
Related Frameworks
Build a complete case toolkit. Profitability rarely shows up in isolation:
- Case Interview Frameworks Complete Guide, the index of all core frameworks with a selector for choosing the right one
- Market Entry Framework, often paired with profitability when a client is evaluating new segments
- Pricing Strategy Cases, the revenue side of profitability, in depth
- Growth Strategy Cases, when the diagnosis points to top-line problems, not cost
- Cost Reduction Case Interview, when the diagnosis points to structural cost problems
- Unit Economics Framework, for per-unit margin analysis when aggregate profit masks segment-level losses
- Banking Case Interview, where the profit equation is rebuilt around net interest income, fee income, and credit losses rather than standard revenue minus cost
- BCG Growth-Share Matrix, for portfolio-level decisions about which business units to invest in versus harvest when margin varies across units
- Case Interview Examples, full worked cases across all major types
Sources and Further Reading (checked June 17, 2026)
- IGotAnOffer, case interview types and frequency data: igotanoffer.com/blogs/mckinsey-case-interview-blog/case-interview-types
- PrepLounge, profitability case type overview: preplounge.com/en/case-interview-basics/case-cracking-toolbox/identify-your-case-type/profitability-case
- Management Consulted, profitability framework: managementconsulted.com/profitability-framework
- CaseInterview.com, profitability case examples: caseinterview.com/case-interview-examples-profitability
- CaseInterview.com, framework overview: caseinterview.com/case-interview-frameworks
- Management Consulted, profitability cases and tips: managementconsulted.com/profitability-case-interview
FAQ
Frequently asked questions
Keep reading
- Start free consulting drillsPractice
- Cost Reduction Case Interview: Framework, Worked Examples, and Common Traps (2026)Frameworks · Mar 20, 2026
- Pricing Case Interview: Strategies, 7-Step Approach, Worked ExampleFrameworks · Feb 3, 2026
- Scale vs Profitability Case Interview: Decision FrameworksFrameworks · Jun 2, 2026
- Unit Economics Framework for Case InterviewsFrameworks · Jun 1, 2026