
Retail Case Interview: Framework, Omnichannel Strategy, and Worked Examples (2026)
Retail case interviews cover profitability, market entry, and omnichannel strategy. Learn the retail-specific framework, key metrics, and worked examples.
On this page
A retail case interview in 2026 asks you to diagnose why a store or chain's profitability is slipping and then recommend a fix, using a profit bridge that decomposes revenue, gross margin by category, channel economics, and fixed costs before you choose an omnichannel move. Retail P&L math is illustrative but instructive: a typical retailer's operating margin sits around 2-8% after gross margin (25-50%), occupancy (8-15%), and labor (12-18%) are stripped out, so a few points of gross-margin erosion from category mix shift can wipe out most of the bottom line. The diagnostic habit that separates strong candidates is checking same-store sales before trusting total revenue, since a chain can grow revenue by opening stores while every existing store gets worse. Omnichannel strategy adds another layer: research from BigCommerce finds that businesses with strong omnichannel strategies retain 89% of customers versus 33% for weak omnichannel operations, but that gap only shows up if you first get the unit economics of online fulfillment right. This guide walks through the five-step framework, a worked department-store example, and the private-label math interviewers expect you to run.
Retail is a common case interview industry. Here's a practical framework you can adapt.
How Retail Economics Actually Work
Before the framework, understand the business model. Retailers buy inventory wholesale, mark it up, and sell it directly to consumers. But the economics get complex:
Retail P&L structure:
Grocery often operates at low single-digit operating margins. Apparel can be higher, and luxury retail can be higher still. When you see a retail profitability case, an early question should be: what is the retail sub-sector, and what is the normal margin range?
The Retail Case Framework
Retail Case Framework
- 01
1. Revenue Drivers. Decompose: # stores × traffic × conversion × average transaction value (ATV). Separately analyze same-store sales vs. new store contribution.
- 02
2. Gross Margin Analysis. Break down margin by category. Where are the margin diluters? Compare category mix shift, pricing changes, and COGS trends.
- 03
3. Cost Structure. Fixed costs (occupancy, corporate overhead) vs. variable costs (COGS, labor, marketing). Which costs have increased faster than revenue?
- 04
4. Channel Economics. In-store vs. online vs. wholesale. What does each channel's margin look like? What is the channel mix shift?
- 05
5. External Factors. Competitive pressure (new entrants, e-commerce), consumer behavior shifts, economic conditions, and supply chain disruptions.
First retail diagnosis rep
Assume a 200-store retailer has $900M in annual revenue and a $45M operating-profit decline. Split the diagnosis across same-store sales, category mix and gross margin, occupancy and labor, and online cannibalization. The expected first branch is gross margin because revenue is flat while margin has fallen. Check that every sub-impact reconciles to the $45M decline before recommending a lever.

Profitability · medium
Try a free live retail case interview
Matched to this retail guide: a live retail and consumer profitability case with an AI interviewer. Free, scored on every step.
Worked Example: Department Store Profitability
Case prompt: Your client is a mid-tier US department store chain with 200 stores. Operating profit has declined from 8% to 3% over the past three years, while revenue has stayed roughly flat. What's causing the decline, and what should the client do?
Step 1: Clarify the structure
Revenue flat + margin declining = the problem is in costs, not top-line volume. Start with the cost decomposition.
Step 2: Diagnose costs
The interviewer reveals:
- Gross margin fell from 48% to 42% (COGS increased as a % of revenue)
- Occupancy costs rose 15% over three years (new store openings with higher rent)
- Labor costs rose 12% (minimum wage increases in key markets)
Step 3: Decompose gross margin
Ask about category mix. The interviewer reveals:
- Apparel (highest margin, ~52%) declined from 45% of revenue mix to 35%
- Home goods (lower margin, ~38%) grew from 20% to 30% of revenue mix
The gross margin decline is primarily a category mix shift: consumers are buying less apparel and more home goods. This is a structural industry trend (rise of fast fashion alternatives like SHEIN/Zara pulling apparel share).
Step 4: Quantify the impact
If apparel went from 45% → 35% of revenue ($900M) and home goods went from 20% → 30%:
- Lost apparel margin: 10% × $900M × (52% − 38%) = $12.6M
- That explains approximately 28% of the $45M operating-profit decline. The $900M figure is the stated annual revenue base for this illustrative case.
Step 5: Recommend
Three-part recommendation:
- Category rebalancing: Exit low-margin home goods categories and reinvest in higher-margin private label apparel
- Occupancy rationalization: Close 20 underperforming stores (negative store-level EBITDA) → reduces fixed cost base
- Omnichannel integration: Invest in BOPIS (buy online, pick up in store) to drive traffic to high-performing locations
Run a BCG profitability case in grocery retail. Revenue grew from $600M to $680M but gross margin stayed flat at $135M. Answer this BCG profitability case step in the article, then continue the full case. Continue the full case on Road to Offer
Key Retail Metrics Candidates Should Know
Omnichannel Strategy Cases
Omnichannel is a major theme in retail cases since 2023. The core question: how does a traditional retailer compete against pure-play e-commerce?
The omnichannel math problem:
E-commerce can have lower gross margins than in-store retail when shipping and fulfillment costs erode margin, but it can also have lower occupancy costs. Use the client's channel economics rather than treating that relationship as universal.
Research by BigCommerce shows businesses with strong omnichannel strategies retain 89% of customers versus 33% for weak omnichannel operations. But that stat masks the investment required to get there.
Key omnichannel case questions:
- What is the unit economics of online vs. in-store fulfillment?
- Is BOPIS (buy online, pick up in store) margin-accretive or dilutive?
- What is the cannibalization rate? Does online growth simply shift sales from stores?
- What technology investment is required for inventory integration?
Private Label Strategy
Private label (store brand) cases are increasingly common. The logic: private label products typically carry 30–50% higher gross margins than national brands, because the retailer buys direct from a manufacturer and eliminates brand licensing.
Worked private label math:
- National brand: sells at $5.99, costs retailer $4.20 → gross margin 30%
- Private label equivalent: sells at $4.99, costs retailer $2.80 → gross margin 44%
The tradeoff: private label requires volume commitment (minimum order quantities), brand-building investment, and quality control. The case question is typically: which categories should the retailer prioritize for private label expansion?
Categories most suitable for private label: commodity-like products (store brand bottled water, basic apparel), where consumers are price-sensitive and perceive low quality risk. Categories unsuitable: premium branded goods where brand identity drives demand (luxury, beauty).
Connect to Other Case Types
Retail cases often blend with other case types you've seen:
- Market entry framework for geographic expansion cases
- Profitability framework as the base for any margin decline case
- Growth strategy cases when the client wants to expand revenue
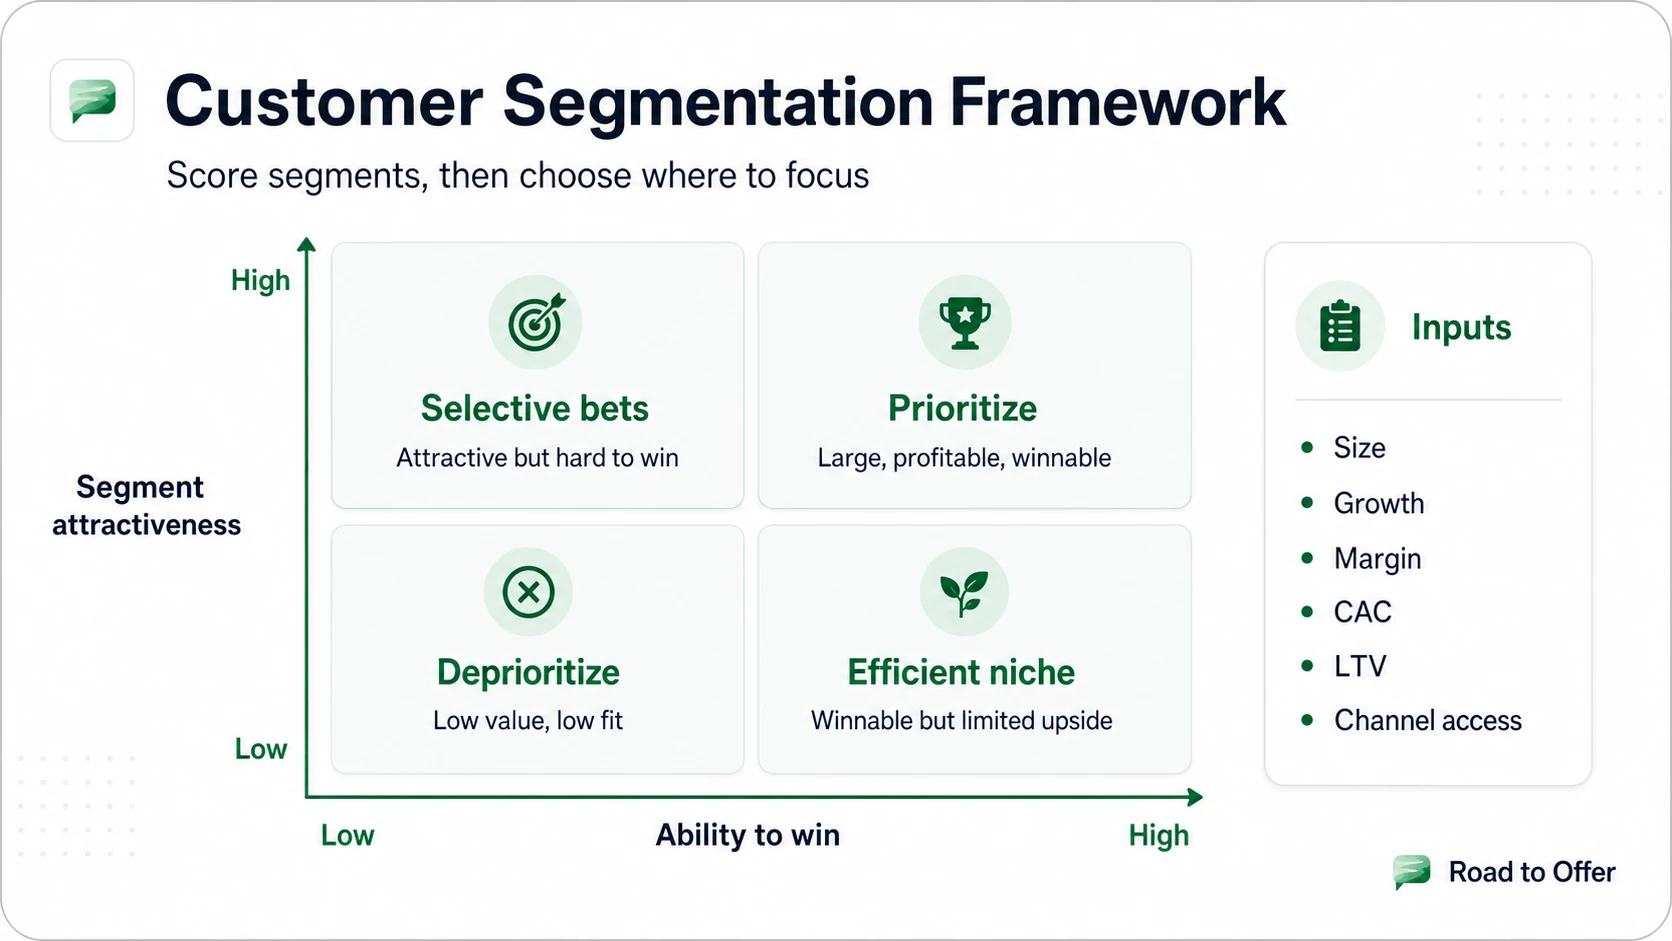
- Customer segmentation framework for targeted marketing cases
- M&A case framework for retail acquisition due diligence
- Supply chain case interview for inventory, logistics, and vendor management cases that drive retail margin
- Consumer goods case interview for the CPG side of retail: brand portfolios, trade spend, and category management with the retailers as the channel
- Customer profitability case interview for loyalty program economics and segment-level margin analysis
- Digital transformation case interview for omnichannel platforms, e-commerce migration, and retail tech stack cases
- Marketing case interview for promotional strategy, pricing architecture, and in-store vs. digital channel mix
Sources and Further Reading (checked June 17, 2026)
- Hacking the Case Interview, Retail Case Guide: hackingthecaseinterview.com/pages/retail-case-interview
- BigCommerce, Omnichannel Retail Statistics: bigcommerce.com/articles/omnichannel-retail
- Management Consulted, Case Interview Overview: managementconsulted.com/case-interview
- BCG Retail Practice Overview: bcg.com/industries/retail
- PrepLounge Retail Industry Cases: preplounge.com/en/management-consulting-cases/retail
Apply the retail diagnosis in FreshCart
Carry the profit bridge into a complete grocery-margin recommendation.
Frequently asked questions
Resources and related guides
- Try a free live retail case interviewPractice
- Browse all free resourcesResource hub
- Airline Case Interview: Profitability Framework, Revenue Drivers, and Worked Examples (2026)Frameworks · Mar 29, 2026
- Ansoff Matrix Case Interview: The 2x2 Growth Framework Explained with ExamplesFrameworks · Mar 25, 2026
- BCG Matrix Explained: Stars, Cash Cows, Question Marks, Dogs (2026)Frameworks · Mar 25, 2026
- Marketing Case Interview: The 5C-STP-4P Framework, Examples, and Drills (2026)Frameworks · Mar 29, 2026