Insurance Case Interview: Framework, Ratios & Example
Insurance case interview guide: underwriting income, float, loss ratio, expense ratio, combined ratio, and a worked P&C example.
On this page
An insurance case interview in 2026 tests the same core skills as any other case (structure, math, business judgment, and synthesis) applied to a business that prices risk for a living, so you do not need to be an insurance expert to pass one. According to the Swiss Re Institute, global insurance premiums surpassed USD 7 trillion for the first time ever, growing 6.1% in nominal terms across life and non-life. Interviewers know the industry is huge, but they are checking whether you can reason, not whether you memorized actuarial tables. What separates strong candidates is a working grasp of how insurers earn money and the three ratios that decode the entire profit and loss statement. This guide gives you the insurance economics in plain language, line-specific metric trees, a tailored profitability framework, a full worked example, and a night-before vocabulary list, so you can walk in calm and structured.
What an Insurance Case Actually Tests (and Why You Are Not Behind)
The fear most candidates carry into an insurance case is that finance majors or actuarial hires have an unfair edge. They do not. The interviewer is not grading your knowledge of reserving regulation. They are grading whether you can take an unfamiliar business, build a clean structure, do the math without panicking, and land a defensible recommendation.
What insurance adds on top of a generic case is a specific profit logic. Once you internalize that logic (covered in the next two sections), an insurance case becomes more predictable than a typical consumer-goods case, because the levers are well defined. Insurance sits inside the broader financial services case interview family, so the structuring instincts you build here transfer to banking and asset-management prompts too.
Set the scope out loud at the start. Confirm the line of business, the geography, and the objective (grow profit, enter a market, price a product, evaluate a deal). That single habit signals you understand insurance is not one monolithic business, which already puts you ahead of candidates who structure every company the same way.
How Insurance Companies Make Money: Two Profit Engines
Most candidates only see the first engine. Strong candidates name both.
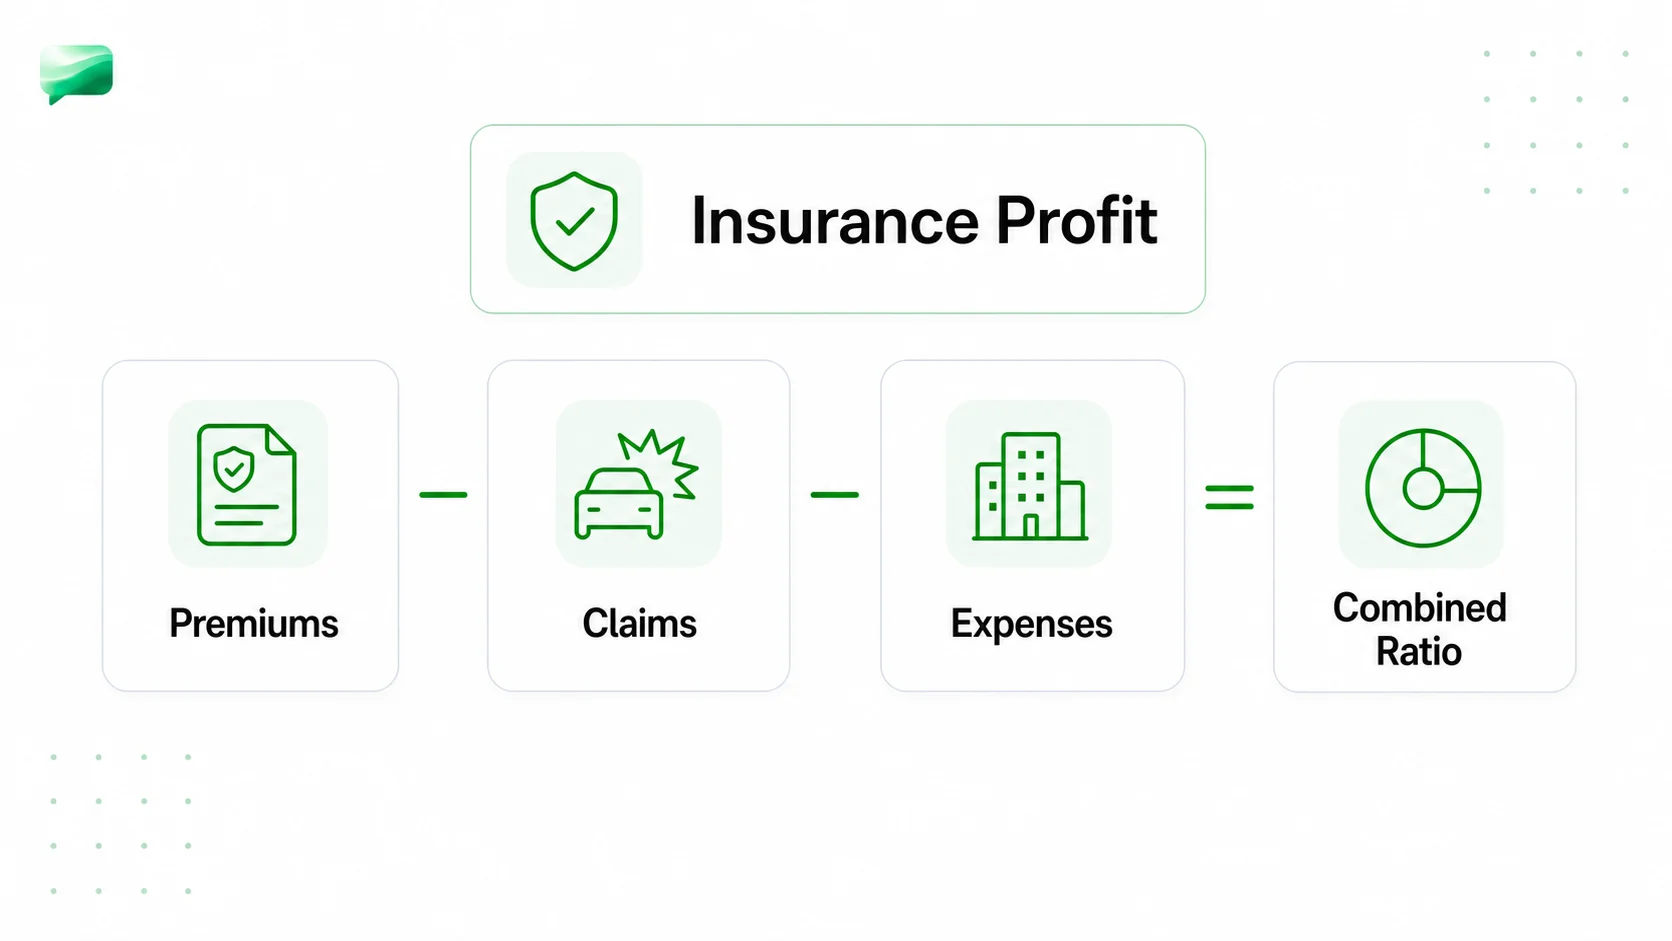
Engine 1: Underwriting income. This is premiums earned minus claims (losses) paid minus operating expenses. An insurer that prices risk well collects more in premiums than it pays out in claims and overhead. That gap is underwriting profit.
Engine 2: Investment income on the float. Insurers collect premiums today but pay claims months or years later. The pool of money they hold in between is called the float, and they invest it. This is the engine candidates most often overlook. In 2024, US property/casualty insurers earned 86.7 billion dollars in net investment income and 169.8 billion dollars in net income after taxes, proof that investment returns are a genuine second profit source, not a rounding error.
The practical takeaway for a case: an insurer can run a thin or even negative underwriting result and still be profitable overall if investment income is strong. When diagnosing profitability, always ask which engine moved. Forgetting the float is one of the fastest ways to look like you do not understand the business.
The Three Numbers That Win Insurance Cases
Three ratios let you read an insurer's P&L the way a balance sheet reads to an accountant.
The rule to memorize: a combined ratio under 100% means the insurer earns an underwriting profit before investment income. Above 100%, the insurer loses money on underwriting and depends on the float to stay in the black.
These are not abstract. The 2024 US P&C industry combined ratio was 96.5, the lowest since 2013. Personal lines came in at 96.7 and commercial lines at 96.3, while the homeowners line improved to 99.7, its first annual underwriting profit since 2019. If you can say "the combined ratio is 96.5, so the industry made about three and a half cents of underwriting profit per premium dollar," you sound fluent without having memorized anything obscure.
The Three Lines You Will Be Cased On
Insurance is not one business. The metric tree changes by line, so identify the line early.
Property & Casualty (auto, home). Short-tail: claims arrive relatively soon after the premium. The profit lever is the loss ratio, which decomposes into claim frequency (how often) times claim severity (how costly). Premiums decompose into policies in force times average premium. P&C is where the combined ratio bites hardest.
Life & Health. Long-tail: policies and payouts can span decades, so reserves and the investment spread matter far more than in P&C. The drivers are mortality and morbidity assumptions, persistency (policyholders keeping coverage), and the gap between investment returns and guaranteed payouts. Margins are thin: one consulting case lists a healthcare payor with roughly 707.4 billion dollars of revenue and 28.3 billion dollars of profit, about a 4% margin, with a 2012 to 2017 revenue CAGR of 5.1%.
Specialty and commercial. Large, lumpy, and harder to price (think marine, cyber, aviation). Here underwriting expertise and reinsurance dominate, because a single claim can be enormous. Intact Financial, for example, entered a specialized insurance market with close to 7.5 billion dollars in annual premiums, the kind of scale that signals a specialty play.
The Most Common Insurance Case Types, Ranked
- Profitability / declining margin. The most common by far. Margin is falling and you isolate whether the cause is a rising loss ratio (more or costlier claims), a rising expense ratio, pricing that lagged claims inflation, or weaker investment income.
- Market entry / geographic expansion. Should the insurer enter a new region or product line? Size the addressable premium pool, assess the local loss experience and regulation, and check whether the firm can price the risk profitably.
- M&A and divestitures. Recognizable real cases anchor this type: Aetna acquiring Humana for 37 billion dollars on the buy side, and AIG divesting a P&C unit with revenues over 25 billion dollars on the sell side.
- Pricing / underwriting strategy. How to set rates, which segments to write or avoid, and how to respond when claims inflation outpaces premium growth.
- Digital and insurtech disruption. How should an incumbent respond to direct-to-consumer and embedded-insurance entrants? The fintech case interview guide covers the digital unit economics those challengers run on.
Which Firms Give Insurance Cases Most Often
Expect insurance prompts most from financial-services specialists. Oliver Wyman asks them frequently given its deep financial-services and actuarial practice. The consulting arms of Deloitte and EY run them across their insurance verticals. MBB generalists (McKinsey, BCG, Bain) bring insurance cases out when they staff financial-services clients, so a generalist offer does not mean you can skip this preparation.
There is plenty of practice material: PrepLounge alone lists roughly 16 insurance cases in its library, including named prompts like Vitality Insurance and a Life Insurance Merger. If you are recruiting for any FS-heavy firm, treat at least one insurance rep as mandatory.
An Insurance-Tailored Profitability Framework
Do not force a generic revenue-minus-cost tree onto an insurer. Decompose profit into the components that actually move an insurance P&L. This is a tailored version of the standard profitability framework, rebuilt around premiums, claims, expenses, and investment income.
Framework
Insurance Profitability Framework
- 01
1. Premiums Earned
Policies in force times average premium. Confirm written vs earned premium, and whether volume or price is moving.
- 02
2. Claims / Losses Paid
The loss ratio. Decompose into claim frequency times severity. This is usually where profitability problems hide in P&C.
- 03
3. Operating Expenses
The expense ratio: acquisition costs (commissions, marketing), administration, and overhead.
- 04
4. Underwriting Result
Premiums minus claims minus expenses. Translate it into the combined ratio and check whether it is above or below 100%.
- 05
5. Investment Income
Returns on the float. A weak underwriting result can still net out positive if investment income is strong, so always include it.
- 06
6. Constraints
Regulation (rate-increase approval), reserving requirements, and reinsurance costs that cap or shape the levers above.
A Worked Example: A Declining-Profitability Auto Insurer
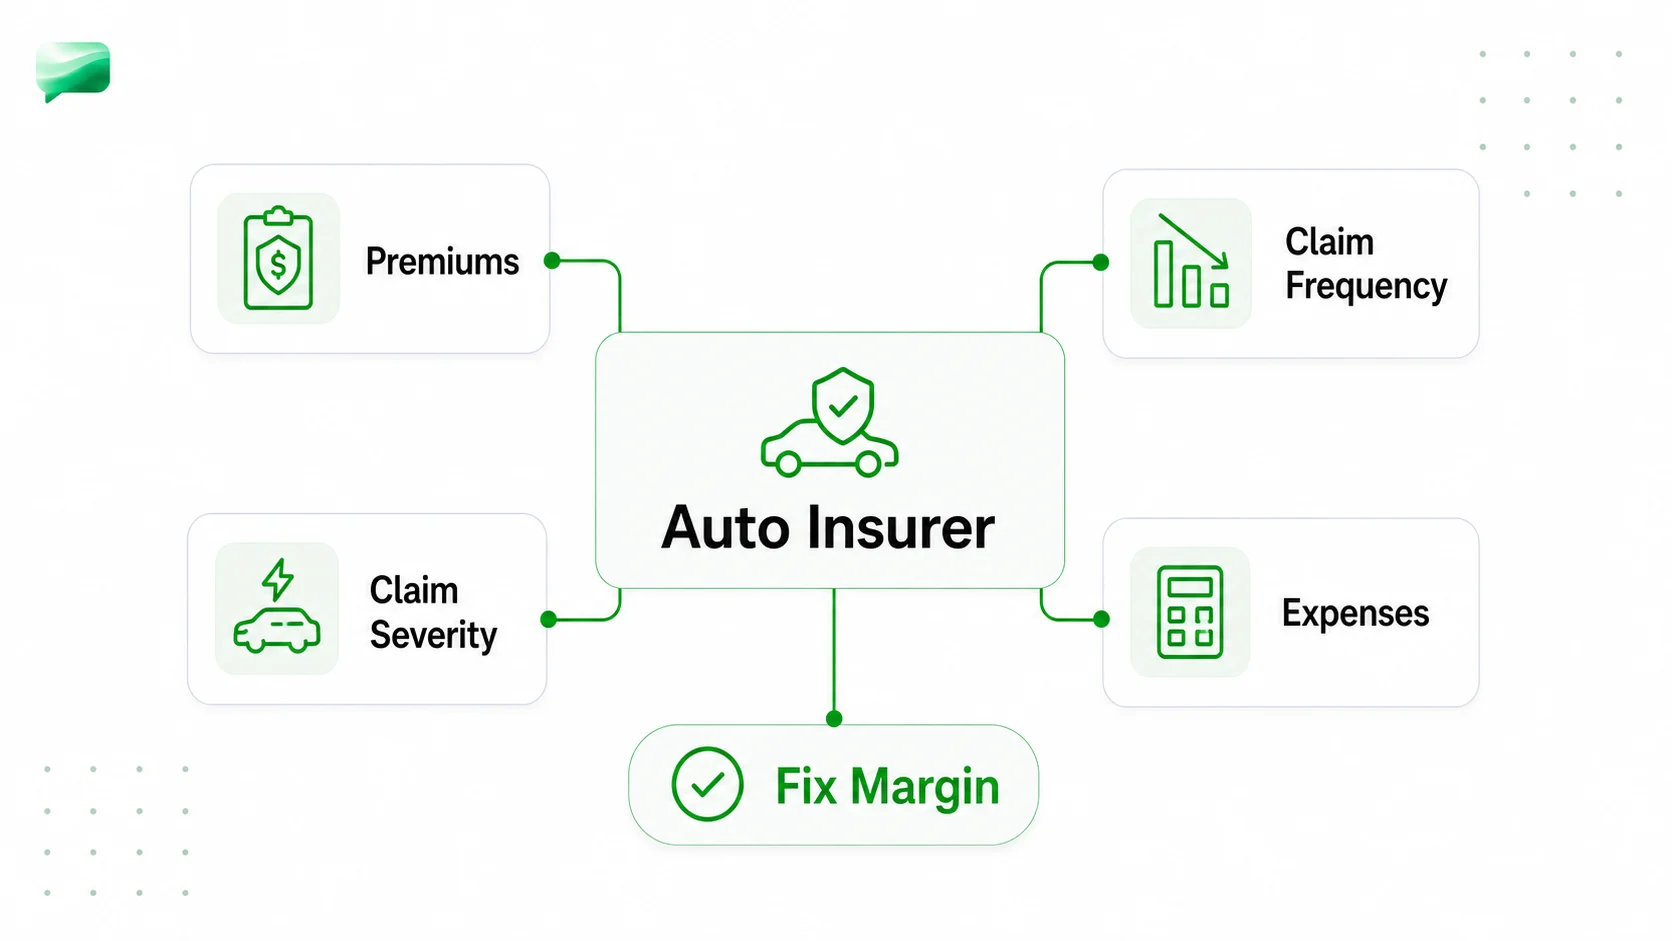
Prompt: A regional auto (P&C) insurer with 1 billion dollars in earned premiums has seen profit erode over two years. Diagnose the cause and recommend a fix.
Step 1: Translate profit into the combined ratio.
Step 2: Isolate the driver. The expense ratio is flat at 28%, so the entire swing sits in the loss ratio, which rose from 70% to 76%. Expenses are not the problem. Claims are.
Step 3: Decompose the loss ratio. Loss ratio equals claim frequency times severity, relative to premiums. Suppose the number of claims per policy is flat, premiums are flat, and average claim cost rose about 8.6% from repair-part and medical-cost inflation. The diagnosis writes itself: pricing has lagged claims inflation. Severity is up and rates did not keep pace.
Step 4: Check the second engine. With a combined ratio of 104%, underwriting is now loss-making. Investment income on the float may soften the blow, but at modest yields it will not fully offset a 40 million dollar underwriting loss. The insurer is genuinely under water, not just optically.
Step 5: Recommendation. File for rate increases to close the pricing gap and target a combined ratio back under 100%, tighten underwriting in the highest-severity segments, and invest in claims management to control severity. Flag the key constraint up front: in most markets, rate increases require regulatory approval, so the fix is not instant. That caveat is exactly the kind of business judgment that separates a strong answer from a textbook one.
Insurance Vocabulary Cheat Sheet (Skim This the Night Before)
- Premium: the price the policyholder pays for coverage. Watch written premium (signed) versus earned premium (recognized over the policy period).
- Claims / losses: payouts to policyholders when an insured event occurs.
- Reserves: money set aside to pay claims that have occurred or will occur but are not yet fully paid. They tie up capital.
- Reinsurance: insurance for insurers. Carriers transfer part of their risk to reinsurers to cap large or correlated losses.
- Underwriting: the process of evaluating and pricing risk, deciding whom to insure and at what rate.
- Actuarial pricing: using historical loss data and statistical models to set premiums that cover expected claims plus a margin.
- Float: premiums held between collection and claim payment, invested to generate investment income.
- Loss ratio / expense ratio / combined ratio: the three numbers above. Combined under 100% equals underwriting profit.
Common Mistakes and How to Stand Out
1. Ignoring investment income. Treating an insurer like a generic product company misses the float entirely. Always name both profit engines.
2. Confusing revenue with premiums. Premiums are the top line, but written premium and earned premium are not the same. Clarify which one the data shows before you do the math.
3. Forcing a generic cost tree. "Revenue minus fixed and variable costs" is the wrong shape. Decompose into premiums, claims, expenses, and investment income instead.
4. Missing regulatory and reserving constraints. Rate increases often need regulator approval, and reserves tie up capital. A recommendation that ignores these is not implementable, and interviewers probe for it.
5. Not separating loss ratio from expense ratio. When margin falls, candidates who say "cut costs" without checking whether the problem is claims or expenses lose the thread. The combined ratio decomposition is your first move every time.
Get those five right and you will out-structure most candidates, regardless of whether you have ever worked a day in financial services.
Sources
- Swiss Re Institute / Beinsure: global insurance premiums surpass USD 7 trillion (checked June 26, 2026)
- Insurance Information Institute: Facts + Statistics industry overview (checked June 26, 2026)
- Insurance Journal: 2024 P&C combined ratio of 96.5 (checked June 26, 2026)
- ConsultingCase101: Life & Health insurance cases (checked June 26, 2026)
- ConsultingCase101: Property & Casualty insurance cases (checked June 26, 2026)
- PrepLounge: insurance case library (checked June 26, 2026)
FAQ