Case Interview Examples and Sample Cases
Practice with case interview examples, sample prompts, and answer structures for market sizing, profitability, pricing, and M&A cases.
On this page
Start with the case type you need to practice, then attempt the prompt before reading the answer. These 12 examples cover profitability, market entry, growth, pricing, M&A, market sizing, and operations, though candidates targeting finance firms should also practice the Capital One case interview format and those targeting tech roles should add data science case interviews. Profitability is the highest-priority starting point because it appears in roughly 30-40% of MBB first-round interviews, according to IGotAnOffer's case type analysis.
Jump to case type:
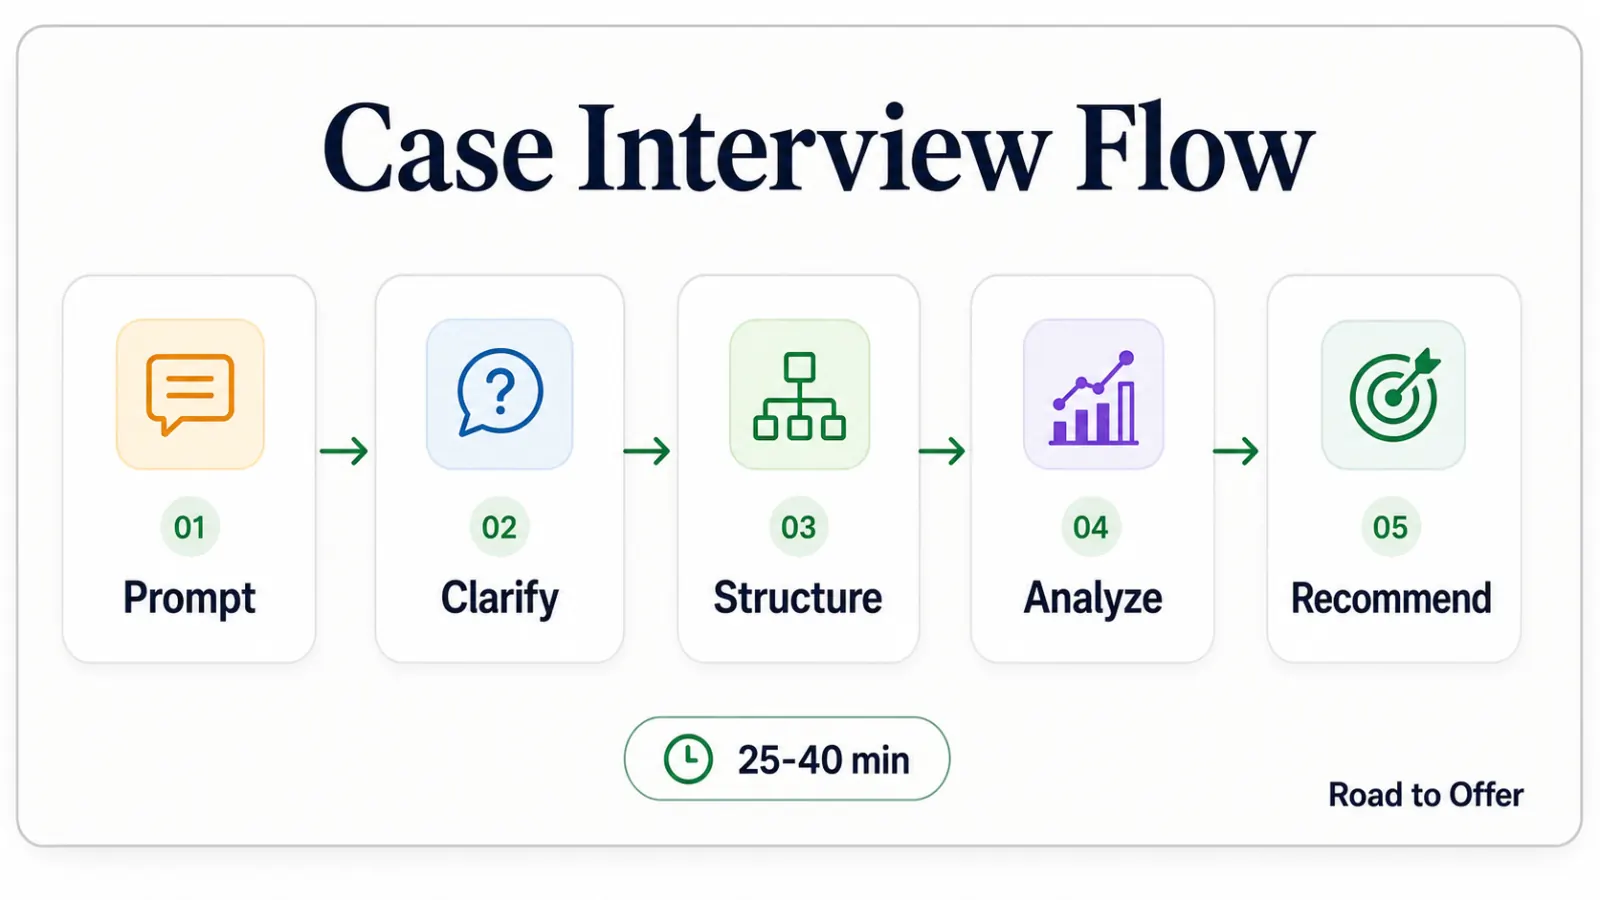
Each example gives you the full arc: prompt, clarifying questions, a case-specific framework, at least one quantitative step, and a synthesis that sounds like something a real consultant would say in a partner meeting. The point is to give you a clear target for what "good" looks like at each stage of a case.
If you learn faster by seeing the performance, pair these written examples with case interview video examples so you can calibrate pacing, silence, math narration, and synthesis delivery.
Here is how to get the most from them:
- Read only the prompt. Set a 90-second timer and sketch your structure on paper.
- Speak your opening statement and hypothesis out loud, even if you are alone.
- Then read the worked answer and compare. Where did your structure diverge? Where was your hypothesis weaker?
- Track your gaps across all 12. Patterns in those gaps tell you exactly what to drill next.
Checklist
Before you start any example
Pen, paper, and 90-second timer ready
You need to build structure under time pressure, not at your leisure.
Say your opening out loud
Silent practice skips the hardest part, articulating under pressure.
Write one hypothesis before reading the answer
Forces you to commit to a direction instead of listing everything.
After each case, write down one specific mistake
Tracking errors across cases reveals your actual weak spots.
The table above shows a strong candidate profile. Study the gap between current scores and targets to understand where most candidates need to improve. Business judgment and synthesis are typically the hardest categories to master.
Profitability Cases (Examples 1-3)
Profitability cases are the most common type you will face, accounting for roughly 30-40% of first-round interviews at MBB firms according to IGotAnOffer's analysis of case interview types and PrepLounge's profitability case guide. The core skill is diagnosis before prescription: figure out what changed before recommending a fix. For the full framework breakdown, see the profitability framework guide.
Example 1: Airline Margin Decline
Airlines are a classic profitability case, which is why this worked airline case interview breaks the same margin diagnosis down end to end.
Prompt: A mid-size regional airline's operating margin dropped from 14% to 8% over 18 months. Revenue grew 4% over the same period. The CEO wants to know what is driving the decline and what to do about it.
Clarifying questions:
- "Is the margin decline consistent across all routes, or concentrated in specific ones?"
- "Have there been any major fleet changes or new route launches in this period?"
Framework:
- Revenue quality: Revenue grew 4%, but is that from volume or price? If the airline added routes at lower yields, the mix shift could be dragging blended margin down.
- Variable costs: Fuel is typically 25-35% of airline operating costs. Check whether fuel costs per ASM (available seat mile) increased, or if load factors dropped (same fuel, fewer paying passengers).
- Fixed cost absorption: If the airline expanded capacity (new aircraft, new crew bases), fixed costs may have stepped up faster than revenue.
- Competitive pricing pressure: Check whether discount carriers entered key routes, forcing yield compression.
Quantitative analysis:
Revenue grew from $620M to $645M (+4%). Operating profit fell from $86.8M (14% of $620M) to $51.6M (8% of $645M), a $35.2M decline. If fuel costs per ASM rose 18% and fuel is 30% of costs, that alone accounts for roughly $96M x 0.18 = $17.3M. The remaining ~$18M gap likely comes from a mix of lower yields on new routes and crew cost step-ups from fleet expansion.
Recommendation: "I recommend a three-lever recovery plan. First, renegotiate fuel hedging contracts to lock in current spot rates, which have declined 8% from the peak, potential impact of $8-10M annually. Second, restructure two underperforming routes launched in the expansion (the data suggests they are operating below 65% load factor), this recovers roughly $12M in losses. Third, implement dynamic yield management on the top 10 routes to recapture $5-7M in pricing. Combined, this targets $25-29M of the $35M gap within four quarters. The main risk is passenger volume loss from route cuts; I would mitigate by redirecting capacity to high-yield routes rather than eliminating it."
Example 2: Grocery Chain Profit Drop
Prompt: A national grocery chain's net margin fell from 3.8% to 2.1% over one year on $12B in revenue. The CEO suspects it is a pricing problem but wants a data-driven diagnosis.
Clarifying questions:
- "Has the margin decline been uniform across store formats (urban, suburban, rural), or concentrated?"
- "Were there any major competitive entries or pricing actions by Walmart or Aldi in key markets?"
Framework:
- Pricing and promotion depth: Grocery margins are thin. Even a 1-2% increase in promotional depth (deeper discounts, more SKUs on promotion) could explain the gap. Check whether promotional spend as a percentage of revenue increased.
- Product mix shift: If private label share declined and branded share grew (or if fresh/deli share dropped vs. center-store), margin mix worsens.
- Cost inflation: Labor (minimum wage increases in key states?), shrinkage (theft/spoilage trends), and logistics costs.
- New store drag: If the chain opened stores in the period, new locations typically run at lower margins for 12-18 months.
Quantitative analysis:
The margin gap is 1.7 percentage points on $12B revenue = $204M in lost profit. If the chain increased promotional depth by 1.5% of revenue (matching a competitor's aggressive campaign), that is $180M, nearly the entire gap. Checking: if average basket discount went from 12% to 13.5%, that tracks. The remaining ~$24M could be explained by labor cost inflation of roughly 3% on a $2B labor base ($60M gross, partially offset by productivity gains).
Recommendation: "The CEO's instinct about pricing is directionally right, but the root cause is promotional depth, not shelf price. The chain matched a competitor's campaign that it did not need to match across all regions. I recommend pulling back promotional depth by 0.8% in non-contested markets (roughly 60% of stores) while holding current levels in competitive overlap zones. Expected margin recovery: $100-120M. Second, implement regional promotion authority so store clusters can make faster competitive responses rather than blanket national campaigns. Risk: volume loss in non-contested markets from reduced promotions. Mitigate by shifting from price promotions to loyalty-program rewards, which have higher retention value per dollar spent."
Example 3: SaaS Company Profitability
Prompt: A B2B SaaS company with $80M ARR has never been profitable. The board wants a path to breakeven within 18 months. Customer growth is 25% year-over-year.
Clarifying questions:
- "What is the current gross margin, and what is the split between hosting costs and customer success headcount in COGS?"
- "What is the current burn rate, and how much runway does the company have?"
Framework:
- Gross margin structure: SaaS companies should target 70-80% gross margins. If this company is below that, the first lever is COGS optimization (hosting efficiency, CS ratio).
- Sales efficiency: What is the CAC payback period? If it exceeds 18 months, the company is spending too much to acquire each dollar of ARR. Check sales headcount productivity.
- Expansion revenue vs. new logo: Net revenue retention above 110% means the existing base is growing itself. Below 100% means the company is on a treadmill, new sales just replace churn.
- Operating expense structure: R&D, G&A, and S&M as a percentage of revenue. Which has grown fastest relative to ARR growth?
Quantitative analysis:
At $80M ARR growing 25%, next-year ARR is ~$100M. Assume current gross margin is 68% (below benchmark) with a $26M operating loss (burn rate). Path to breakeven requires $26M in margin improvement on ~$100M revenue. Lever 1: Improve gross margin from 68% to 74% by migrating to reserved cloud instances and raising CS-to-customer ratio from 1:15 to 1:25, saves ~$6M. Lever 2: Reduce S&M spend from 55% to 45% of revenue by shifting from outbound to product-led growth for SMB segment, saves ~$10M. Lever 3: Natural operating leverage from 25% revenue growth on a partially fixed cost base contributes ~$10M. Total: $26M in improvement, reaching breakeven at ~$100M ARR.
Recommendation: "The company can reach breakeven in 18 months through three parallel levers: gross margin optimization ($6M), sales efficiency improvements ($10M), and natural operating leverage from growth ($10M). I would not recommend cutting R&D, at this growth stage, product investment protects the expansion revenue that makes the math work. The critical dependency is maintaining 25% growth; if growth slows to 15%, the timeline extends to 24-30 months and requires deeper S&M cuts. I would set a quarterly checkpoint at the board level with a contingency plan if Q2 growth dips below 20%."
 McKinsey
Profitability · medium
Race to the Bottom Airline Profitability
A full profitability case like Example 1: diagnose what is dragging an airline's margin, then build the recovery plan out loud with live feedback.
Market Entry Cases (Examples 4-5)
Market entry cases are the second most common case type, typically appearing in 15-20% of consulting interviews. McKinsey's case interview page and PrepLounge's market entry guide both describe entry cases as tests of systematic market evaluation, covering market attractiveness, competitive dynamics, capability fit, and entry mode. The common mistake is spending all your time on market attractiveness and never addressing whether the client can actually win. For the step-by-step approach, see the market entry framework; for the industry-attractiveness lens, use Porter's Five Forces.
Example 4: US SaaS Company Entering Germany
Prompt: A US-based B2B SaaS company ($200M ARR, project management software) is considering entering Germany. The market has strong demand signals but no established local channel partnerships. Should they enter now, phase the entry, or wait?
Clarifying questions:
- "What percentage of current revenue comes from international markets, and does the company have any existing European customers?"
- "Are there dominant local competitors in Germany, or is the market fragmented?"
Framework:
- Market attractiveness: Germany is the largest economy in Europe (~$4T GDP). B2B SaaS adoption is 3-5 years behind the US but accelerating. Estimate the TAM for project management software in Germany: ~500K companies with 50+ employees x 15% current adoption rate x $15K average annual contract = ~$1.1B market, growing 20% annually.
- Competitive landscape: If the market is fragmented (no player above 15% share), there is room for a strong US entrant. If one local player dominates, the cost to win is much higher.
- Ability to win: Does the product support German language, GDPR compliance, and local payment methods? Is the sales motion self-serve (easier to scale cross-border) or enterprise (requires local sales team)?
- Entry mode and economics: Three options: (a) remote selling from US with localized product, (b) local office with 5-10 person team, (c) channel partnership with a German IT services firm.
Quantitative analysis:
Target: capture 2% of the $1.1B German market in 3 years = $22M ARR. Option (a) remote: low cost ($1-2M/year) but likely limited to SMB segment, realistic capture of $5-8M. Option (b) local office: higher cost ($4-6M/year including 8 hires) but can pursue mid-market and enterprise, realistic capture of $15-22M. Option (c) channel: moderate cost ($2-3M/year in partner margins and enablement) with faster initial traction but lower control, realistic capture of $10-15M. The breakeven analysis favors option (b) if the company can afford the upfront investment, with payback in ~30 months.
Recommendation: "I recommend a phased entry. In months 1-6, launch with remote selling and a localized product to validate demand with SMB customers, this costs $1.5M and generates early signal. If pipeline conversion exceeds 15% in the first two quarters, open a Berlin office in month 7 with a 5-person team focused on mid-market. This phased approach limits downside to $1.5M if the market does not respond, while preserving the upside of a $20M+ ARR market. The key risk is hiring, German enterprise sales talent is competitive. I would start recruiting in month 3, before the go/no-go decision, to avoid a 6-month hiring lag."
Example 5: Consumer Brand Entering India
Prompt: A European premium skincare brand ($400M global revenue, sold in 15 countries) is evaluating India as its next market. The CEO is excited about the 1.4 billion population. Should the company enter?
Clarifying questions:
- "What is the brand's price point relative to average skincare spending in India, and which income segment are we targeting?"
- "Does the company have existing supply chain or distribution relationships anywhere in South or Southeast Asia?"
Framework:
- Addressable market reality: India has 1.4B people, but the premium skincare market is a fraction of that. Segment by income: ~30M households in the top income bracket that could afford premium skincare. At $50 average annual spend on premium products, that is a $1.5B premium skincare market, meaningful but far smaller than the "1.4B people" headline suggests.
- Distribution complexity: India's retail landscape is fragmented: millions of small stores, uneven modern trade penetration. E-commerce (Nykaa, Amazon India) is growing fast and may be the right initial channel for premium products.
- Competitive positioning: International competitors (L'Oreal, Estee Lauder) are already present. Local brands (Mamaearth, Forest Essentials) have strong traction with Indian consumers. The brand needs a clear positioning angle.
- Regulatory and operational: Import duties on cosmetics (10-20%), BIS certification requirements, and local manufacturing incentives all affect the cost structure.
Quantitative analysis:
Target: capture 1.5% of the $1.5B premium skincare market in 3 years = $22.5M revenue. Entry via e-commerce first (Nykaa + D2C site): marketing spend of $8-10M/year, logistics and fulfillment costs of 15% of revenue, import duties of 15%. Gross margin in India would be ~55% vs. 72% in Europe due to duties and logistics. At $22.5M revenue and 55% gross margin, gross profit is $12.4M. After $9M in marketing and $2M in local operations, operating profit is ~$1.4M, barely breakeven. Profitability only works at scale: at $40M+ revenue, operating margin reaches 10-12%.
Recommendation: "I would recommend entering India through an e-commerce-first strategy via Nykaa and a branded D2C site, targeting the top 30M households in Tier 1 cities. However, the CEO should understand that this market will not be meaningfully profitable until it reaches $40M in revenue, which likely takes 4-5 years. The near-term business case is strategic: building brand equity in a market that is growing 18% annually. If the board requires profitability within 2 years, India is the wrong market. I would redirect attention to South Korea or Japan where premium margins are stronger and distribution is simpler. The key decision is whether this is a profit play or a market-building play."
 BCG
BCGMarket entry · medium
Coolant Co. US Market Entry
Run a live market entry case in the same vein as Examples 4 and 5: weigh market attractiveness against the ability to win, then pick an entry mode.
Growth Cases (Examples 6-7)
Growth cases shift the mindset from "what went wrong" to "what should we do next." The key skill is generating options and then ruthlessly prioritizing. See the growth strategy cases guide for the full framework.
Example 6: DTC Brand Growth Plateau
Prompt: A direct-to-consumer fitness apparel brand grew revenue from $20M to $85M over 4 years. In the last year, growth slowed from 30% to 8%. The founder wants to reignite growth to 25%+ and is considering wholesale partnerships, international expansion, and new product categories.
Clarifying questions:
- "What is the customer acquisition cost trend over the last 2 years, and what channels drive most new customers?"
- "What is the repeat purchase rate, and how does it compare to the first 2 years of the business?"
Framework:
- Diagnose the slowdown: Before choosing a growth lever, understand why growth decelerated. Most likely: rising CAC on Facebook/Instagram (the DTC playbook is hitting diminishing returns), market saturation in the core customer segment, or declining repeat rates.
- Option A: Wholesale partnerships: Placing product in Nordstrom, REI, etc. provides immediate revenue scale but compresses margins (wholesale is typically 50% of retail price) and risks brand dilution.
- Option B: International expansion: UK, Germany, and Australia are natural markets. Requires localized logistics, marketing, and potential customs complexity. Time to meaningful revenue: 12-18 months.
- Option C: New product categories: Expanding from fitness apparel into adjacent categories (shoes, accessories, recovery gear). Uses the existing customer base but requires product development investment and potential brand stretch.
Quantitative analysis:
Current: $85M revenue, 8% growth = organic trajectory of ~$92M next year. Target: 25% growth = $106M, requiring $21M incremental revenue above organic. Option A (wholesale): a Nordstrom partnership could generate $8-12M in Year 1 wholesale revenue. At 50% wholesale margin vs. 70% DTC margin, the $10M in wholesale revenue contributes $5M gross profit vs. $7M if sold DTC. Option B (international): UK/Australia launch could generate $5-8M in Year 1 but requires $3M setup investment. Option C (new categories): footwear launch could generate $6-10M from existing customers (assuming 15% of the 200K active customer base buys at $300 average price). The math says you likely need two of the three options to hit $21M.
Recommendation: "I recommend prioritizing new product categories and selective wholesale, while deprioritizing international for now. New categories (starting with footwear) can generate $6-10M by monetizing the existing customer base, this is the highest-ROI lever because it does not require acquiring new customers. Selective wholesale with 2-3 premium retailers adds $8-12M and introduces the brand to new audiences, partially offsetting the rising CAC problem. I would hold international expansion for Year 2, once the new category is proven and can be launched simultaneously in new markets. The combined plan targets $14-22M in incremental revenue, putting the 25% growth target within reach. The risk with wholesale is margin compression and brand positioning, mitigate by limiting to premium partners and maintaining DTC-exclusive colorways."
Example 7: B2B Software Expansion
Prompt: A B2B software company sells inventory management tools to mid-market retailers ($50M ARR, 500 customers). Growth has been 15% for three years. The board wants 30%. The VP of Sales proposes three options: upsell existing customers, expand into the restaurant vertical, or enter the UK market.
Clarifying questions:
- "What is the current net revenue retention rate, and what percentage of customers are on the base tier vs. premium tier?"
- "Do we have any existing customers in the restaurant space or any UK customers?"
Framework:
- Upsell existing customers: If only 30% of 500 customers are on the premium tier, there is significant expansion revenue available. Low execution risk because relationships already exist.
- New vertical (restaurants): Restaurants have different inventory needs (perishable goods, daily ordering cycles). The product may require significant modification. The restaurant mid-market is large (~200K establishments in the US with $1M+ revenue) but the sales cycle and product fit are unknowns.
- New geography (UK): The UK mid-market retail landscape is smaller but similar in structure to the US. Product localization is modest (currency, VAT). Requires local sales team.
- Execution capacity: Can the company pursue all three simultaneously, or does it need to sequence? Engineering bandwidth and sales hiring are usually the binding constraints.
Quantitative analysis:
Target: 30% growth on $50M = $15M incremental ARR (vs. $7.5M at current 15% growth, so need $7.5M above baseline). Upsell: 350 customers on base tier x $20K average upsell = $7M potential. If 30% convert in Year 1, that is $2.1M. Restaurant vertical: assume 12-month product adaptation, first revenue in month 9. Year 1 realistic: $1-2M from 20-40 early adopters. UK entry: 6-month setup, first revenue in month 4. Year 1 realistic: $2-4M from 30-50 customers. Combined realistic Year 1: $5.1-8.1M incremental. To hit the full $7.5M incremental, the company likely needs all three, but sequenced.
Recommendation: "Start with the upsell motion immediately, it is the fastest path to incremental ARR with the lowest execution risk, and it buys time for the other two initiatives. In parallel, begin UK market setup (month 1) and restaurant vertical product scoping (month 1), but stagger the launches: UK goes live in month 5, restaurant pilot in month 9. This sequencing avoids overwhelming the sales and engineering teams. Realistic Year 1 outcome is $5-8M incremental on top of the organic $7.5M, bringing total growth to 25-31%. To reliably hit 30%, the upsell conversion rate needs to reach 35%, I would make that the leading KPI for the first two quarters."
 BCG
BCGGrowth · medium
PeakFit Omnichannel Growth Plan
A fitness brand growth case like Example 6: generate the growth options, then prioritize and size the one that beats the alternatives.
Pricing Cases (Examples 8-9)
Pricing cases require three lenses: cost floor, competitive reference, and value ceiling. Most candidates lean too hard on cost-plus and ignore willingness to pay. For the full framework, see the pricing strategy cases guide.
Example 8: Subscription Price Increase
Prompt: A B2C streaming service has 8M subscribers at $12/month. The CFO wants to raise the price to $14/month to improve margins. Marketing estimates 5-8% churn from the increase. Should the company proceed?
Clarifying questions:
- "What is the current churn rate before any price increase, and what is the average subscriber lifetime?"
- "Have competitors recently changed their pricing, and where does $14 sit relative to the competitive set?"
Framework:
- Direct revenue math: Calculate revenue impact: price increase revenue vs. lost revenue from churned subscribers.
- Competitive positioning: If Netflix is $15, Hulu is $10, and this service is $12, moving to $14 puts it near the premium end. Does the content library justify that positioning?
- Customer segmentation: Not all subscribers have equal price sensitivity. Power users (10+ hours/week) are far less likely to churn than casual users (2 hours/week). A tiered approach may capture more value.
- Long-term LTV impact: Even if short-term revenue increases, higher churn reduces the subscriber base, which affects content licensing leverage and advertiser revenue.
Quantitative analysis:
Current: 8M subscribers x $12/month x 12 = $1.152B annual revenue. Scenario A (flat $14 increase): At 5% churn, 7.6M subscribers x $14 x 12 = $1.277B (+$125M). At 8% churn, 7.36M subscribers x $14 x 12 = $1.236B (+$84M). Scenario B (tiered: $10 basic, $14 standard, $18 premium): Assume migration of 20% to basic, 60% to standard, 20% to premium, with only 3% total churn. Revenue: (1.6M x $10 + 4.66M x $14 + 1.55M x $18) x 12 = ($16M + $65.2M + $27.9M) x 12 = $1.309B (+$157M). The tiered approach generates $32-73M more revenue than the flat increase while reducing churn risk.
Recommendation: "I recommend the tiered pricing approach over the flat increase. It generates $157M in incremental annual revenue versus $84-125M from the flat increase, while limiting churn to an estimated 3% because price-sensitive customers have a downgrade option rather than a cancel-or-pay binary. Implementation: announce with 60 days notice, default existing subscribers to the Standard tier, and offer a 3-month loyalty discount to reduce initial churn shock. The key risk is that more than 20% migrate to the Basic tier, I would run an A/B test with 500K subscribers over 4 weeks before full rollout."
Example 9: New Product Launch Pricing
Prompt: A medical device company has developed a new surgical robot that reduces procedure time by 35% compared to the current standard. The product costs $850K to manufacture. The company needs to set an initial price for US hospitals.
Clarifying questions:
- "What does the current standard surgical robot cost, and what is the typical procurement cycle for hospitals?"
- "How many procedures per year does a hospital perform with this type of robot, and what is the revenue per procedure?"
Framework:
- Cost floor: Manufacturing cost of $850K plus target gross margin. At 60% gross margin (typical for medical devices), the floor price is $2.125M.
- Competitive reference: If the current standard robot sells for $1.8-2.2M, the new product needs to justify a premium. The 35% time savings is a strong value driver.
- Value ceiling: Calculate the economic value to the hospital from the 35% time reduction: more procedures per day, lower anesthesia costs, shorter OR occupation.
- Strategic considerations: Is the company going for penetration (lower price, higher volume, build installed base for consumables revenue) or premium (higher price, slower adoption, signal quality)?
Quantitative analysis:
Value to the hospital: A hospital performing 500 procedures/year at $15K revenue per procedure with the current robot. A 35% time reduction means the OR can handle ~175 additional procedures per year. At $15K revenue and $6K variable cost per procedure, that is 175 x $9K = $1.575M in incremental annual profit for the hospital. Over a 7-year robot lifecycle, the NPV of that value (at 8% discount rate) is approximately $8.1M. The value ceiling is therefore the current robot price ($2.0M) plus a share of the $8.1M in created value. If the company captures 30% of the value, the price would be $2.0M + $2.4M = $4.4M.
Recommendation: "I recommend pricing the robot at $3.2-3.5M, which represents a 60-75% premium over the current standard. This captures roughly 15-19% of the $8.1M in value created for the hospital, well below the 30% ceiling, which gives sales teams negotiation room and makes the ROI compelling for hospital CFOs (payback in under 2.5 years). I would not go below $2.8M even for early adopter discounts, as medical devices are nearly impossible to reprice upward after launch. For the first 20 installations, offer an extended warranty and training package rather than price concessions. The biggest risk is slow adoption due to procurement cycle length, budget for 18-24 months before volume ramps."
 McKinsey
Pricing · hard
Lux Rides Vietnam Pricing
A live pricing case like Examples 8 and 9: triangulate across cost floor, competitive reference, and value ceiling instead of defaulting to cost-plus.
M&A Case (Example 10)
M&A cases combine financial analysis with strategic logic. The core question is always: does 1+1 equal more than 2? For more depth, see the M&A case framework guide.
Example 10: Private Equity Acquisition
Prompt: A private equity firm is evaluating the acquisition of a mid-size cybersecurity company with $120M revenue, 15% EBITDA margins, growing 20% annually. The asking price is $600M (5x revenue). Should the PE firm proceed?
Clarifying questions:
- "What is the PE firm's target IRR, and what is the typical hold period?"
- "Is the cybersecurity company's revenue mostly recurring (SaaS/subscriptions) or project-based?"
Framework:
- Standalone value: Is the company worth $600M on its own fundamentals? $120M revenue x 20% growth x 15% EBITDA margin. Project forward 5 years of cash flows and terminal value.
- Value creation levers: Can the PE firm improve margins (operational efficiency, pricing optimization), accelerate growth (add-on acquisitions, new channels), or optimize capital structure (leverage)?
- Market and competitive risk: Cybersecurity is fast-moving. Is the company's technology defensible? Customer concentration risk? Key-person risk?
- Exit multiple and path: What exit multiple is realistic in 5 years? Strategic buyer (higher multiple) vs. IPO vs. secondary sale?
Quantitative analysis:
Entry: $600M at 5x revenue. Assume 60% debt / 40% equity = $240M equity check. Projections over 5 years: Revenue grows from $120M to $300M (20% CAGR). With margin expansion from 15% to 22% (PE operational improvements), EBITDA grows from $18M to $66M. Exit at 15x EBITDA (cybersecurity sector median for growing companies) = $990M. Less $360M remaining debt (assuming partial paydown) = $630M equity value. Return on $240M equity = 2.6x multiple, or approximately 21% IRR over 5 years. This meets the typical 20%+ PE target, but with thin margin for error.
Recommendation: "The deal meets the return threshold at 21% IRR, but barely. I would proceed only if the due diligence confirms two conditions: first, that revenue is 80%+ recurring (which supports the 5x entry multiple and makes the growth projection defensible), and second, that EBITDA margins can realistically reach 22% through specific operational levers the PE firm has identified, not just assumed improvement. If margins only reach 18%, the IRR drops to ~17%, which is below threshold I would negotiate the price down to $500-520M (4.2-4.3x revenue) to build in a margin of safety. The biggest risk is technology disruption. Cybersecurity companies can lose relevance quickly if they miss a platform shift."
 BCG
BCGM&A · medium
NorthStar Logistics Acquisition of RouteWave TMS
An acquisition case like Example 10: pressure-test whether the deal creates value, then make the buy-or-walk call out loud with live feedback.
Market Sizing Case (Example 11)
Market sizing tests your ability to build a logical estimation from defensible assumptions. The key is structure and sanity checks, not precision. See market sizing step-by-step for the full approach, and mental math for case interviews for speed tips.
Example 11: US Coffee Shop Revenue
Prompt: Estimate the total annual revenue of coffee shops in the United States.
Clarifying questions:
- "Are we including all coffee-focused establishments (Starbucks, independents, kiosks), or only sit-down cafes?"
- "Should we include coffee sold at fast-food restaurants like McDonald's, or only dedicated coffee shops?"
Framework (bottom-up approach):
- Number of coffee shops. Estimate from population and density.
- Revenue per shop. Estimate from transactions per day and average ticket.
- Cross-check. Validate with a top-down approach (US population x coffee consumption).
Quantitative analysis (bottom-up):
US population: ~330M. Roughly 70% are adults (231M). About 60% of adults drink coffee regularly = ~139M coffee drinkers. Not all buy from shops, so assume 40% buy from a coffee shop at least once per week = ~56M weekly coffee shop buyers.
Number of coffee shops: ~35,000 Starbucks + ~40,000 other chains and independents = ~75,000 total. Revenue per shop: assume 300 transactions per day (mix of busy and slow locations), average ticket of $5.50 (coffee plus occasional food). Daily revenue per shop: $1,650. Annual revenue per shop: $1,650 x 365 = ~$602K.
Total market: 75,000 shops x $602K = ~$45B.
Top-down cross-check: 56M weekly buyers x 2.5 visits per week x $5.50 per visit x 52 weeks = ~$40B. The two estimates are within 12% of each other, which is a strong sanity check.
Synthesis: "I estimate the US coffee shop market at approximately $40-45B in annual revenue. The bottom-up approach gives $45B based on 75,000 shops averaging $600K in revenue. The top-down approach gives $40B based on 56M weekly buyers spending $5.50 per visit. Both estimates converge, which gives me confidence in the range. If I had to pick a point estimate, I would say $43B, acknowledging that my shop count might be slightly high for rural areas but my average ticket might be slightly low for urban markets."
Operations Case (Example 12)
Operations cases focus on process improvement, capacity planning, or supply chain optimization. They are less common but test a different skill set: understanding physical processes and operational constraints.
Example 12: Warehouse Fulfillment Bottleneck
Prompt: An e-commerce company's main warehouse is failing to meet its 2-day shipping promise. Currently, 30% of orders ship late (beyond 48 hours from order placement). The CEO wants to get late shipments below 5% without building a new warehouse.
Clarifying questions:
- "Where in the process is the bottleneck: picking, packing, or carrier pickup scheduling?"
- "Is the problem consistent throughout the week, or concentrated on specific days (e.g., post-weekend order surges)?"
Framework:
- Process mapping. Break the fulfillment flow into stages: order received, inventory allocated, pick, pack, label, stage for carrier, carrier pickup. Identify which stage has the longest queue time.
- Capacity analysis. What is the theoretical throughput of each stage? The bottleneck is the stage where actual throughput is closest to theoretical maximum.
- Demand variability. If orders spike 2-3x on Mondays (from weekend shopping), a warehouse staffed for average demand will always fail on peak days.
- Quick wins vs. structural fixes. Separate solutions that work in 2 weeks (shift scheduling, overtime) from those that take 3-6 months (automation, layout redesign).
Quantitative analysis:
Assume the warehouse processes 10,000 orders/day on average, with Monday peaks of 16,000. Current capacity: 11,500 orders/day across two shifts. On an average day, utilization is 87% and most orders ship on time. On Monday, demand exceeds capacity by 4,500 orders, and those roll into Tuesday, which then starts behind. The cascade means Wednesday orders are still delayed. The 30% late-shipment rate is driven almost entirely by the Monday-Tuesday-Wednesday surge.
Fix analysis: Adding a 6-hour third shift on Sunday night through Wednesday costs ~$180K/month in labor (30 additional workers at $20/hour x 6 hours x 20 days). This adds 3,000 orders/day of capacity on peak days, bringing Monday capacity to 14,500, still below the 16,000 peak but enough to reduce the cascade. Combining the third shift with staggered carrier pickups (adding a 2 PM pickup to the existing 6 PM pickup) allows earlier clearance and gets capacity to effectively 15,500. Remaining gap of 500 orders on peak Mondays could be handled by pre-picking predictable replenishment orders on Sunday.
Recommendation: "I recommend three immediate actions: add a partial third shift on peak days (Sunday night through Wednesday), add a midday carrier pickup, and implement Sunday pre-picking for predictable orders. Combined cost is approximately $200K/month, with projected late-shipment reduction from 30% to 6-8%. To reach the 5% target, phase two should optimize the pick path layout to increase per-worker throughput by 15%. This takes 8-12 weeks to implement but gets us below 5% without any capital expenditure. I would not recommend building a new warehouse because the problem is peak-day capacity, not average capacity. Solving the peak through scheduling is 10x cheaper than adding square footage."
 McKinsey
Operations · medium
MetroFresh Distribution Center Operations Turnaround
A live operations case like Example 12: map the process, find the bottleneck, and fix throughput without throwing capital at it.
Common Mistakes When Practicing Case Examples
Knowing what "good" looks like is half the battle. The other half is catching yourself when you fall into these patterns.
Mistake 1: Reading the solution before attempting the case
What it looks like: You read the prompt and immediately scroll to the framework and recommendation. You nod along and think "I would have done that."
Why it hurts: You are training recognition, not recall. Interviews test recall, and you have to generate the structure from scratch with someone watching you.
Fix: Cover the answer (physically or digitally). Set a 90-second timer. Write your structure. Only then compare.
Mistake 2: Using the same framework for every case type
What it looks like: Every case gets "Revenue minus Costs" or "Market Size, Competition, Capabilities" regardless of whether it is a pricing case, an operations case, or an M&A case.
Before: "Let me break this surgical robot pricing question into revenue and costs..." After: "Let me use three pricing lenses, cost floor, competitive reference, and value ceiling, to triangulate the right price point."
Fix: Each of the 12 examples above uses a different framework tailored to the case type. Study the differences between them.
Mistake 3: Giving a recommendation without numbers
What it looks like: "I recommend the company enter India because it is a large and growing market with significant potential."
Before: "I recommend entering India. The market is large and growing." After: "I recommend entering India via e-commerce, targeting $22.5M revenue in 3 years from the 30M addressable premium households. Breakeven requires reaching $40M in revenue, so this is a 4-5 year strategic investment."
Fix: Every recommendation needs at least one number. Revenue impact, cost, payback period, or market share target.
Mistake 4: Skipping the risk statement
What it looks like: You give a confident recommendation and stop. The interviewer asks "What could go wrong?" and you scramble.
Before: "I recommend the phased entry plan." After: "I recommend the phased entry plan. The key risk is that pipeline conversion in the first two quarters falls below 15%, in which case I would delay the office opening and redirect that $4-6M budget to double down on remote selling with localized content."
Fix: Build the habit of always ending with: "The main risk is X; I would mitigate by Y." It takes 15 seconds and signals senior-level thinking.
Mistake 5: Spending too long on structure, too little on synthesis
What it looks like: You deliver a beautiful MECE framework, do solid analysis, and then stumble through a vague, rambling conclusion.
Fix: Practice the last 60 seconds of every case separately. Record yourself giving a 30-second synthesis after working through a case. A strong synthesis has three parts: recommendation, one supporting number, and one risk with mitigation.
What to Practice Next
If you worked through all 12 examples actively, you now have a reference point for what "good" looks like across every major case type. The next step is live practice, working through cases in real time where you cannot pause and think for five minutes.
The sequence that works best for most candidates:
- Do 5 more solo cases with a timer, recording yourself and reviewing the recording.
- Do 5 cases with a partner (friend, classmate, or AI practice tool) who can push back on your structure.
- Do 5 cases under realistic conditions, full interview format with time pressure, behavioral warm-up, and no notes.
To keep that pipeline of fresh prompts full, pull from the major MBA club casebooks in our free consulting case book vault instead of re-running the same five cases.
For the detailed practice sequence, see how to practice case interviews, including BCG practice cases if BCG is on your list. For tools that give you structured feedback, see best case interview prep tools in 2026.
Sources and Further Reading (checked June 17, 2026)
- McKinsey interviewing resources and case format: mckinsey.com/careers/interviewing
- BCG case interview preparation: careers.bcg.com/case-interview-preparation
- Bain case interview preparation: bain.com/careers/hiring-process/case-interview
- IGotAnOffer, 47 case interview examples from McKinsey, BCG, Bain: igotanoffer.com/blogs/mckinsey-case-interview-blog/case-interview-examples
- IGotAnOffer, 10 case interview types with frequency analysis: igotanoffer.com/en/advice/types-of-case-interview
- PrepLounge, profitability case type overview: preplounge.com/en/case-interview-basics/case-cracking-toolbox/identify-your-case-type/profitability-case
- PrepLounge, market entry case guide: preplounge.com/en/case-interview-basics/market-entry
- CaseInterview.com case interview examples: caseinterview.com/case-interview-examples
- Management Consulted case interview examples: managementconsulted.com/case-interview-examples
Related Guides
FAQ
Frequently asked questions
Keep reading
- Run a real case interviewPractice
- Case Interview Questions: 6 Case Interview Types (With Worked Solutions)Getting Started · Feb 6, 2026
- Case Interview Tips: 10 Common Mistakes and How to Avoid Them (2026)Getting Started · Feb 19, 2026
- Case Interview Tool Comparisons: Road to Offer vs PrepLounge vs RocketBlocks vs CoachingGetting Started · Feb 5, 2026
- Free Consulting Case Books: HBS, Wharton, INSEAD PDFs (2026)Getting Started · May 9, 2026