Case Interview Math: Mental Shortcuts to Calculate Faster
Mental math shortcuts for case interviews: CAGR rules, percentage tricks, large-number estimation, and 10+ timed drills to build MBB-level speed.
On this page
The fastest case interview math shortcuts are simple: round first, use 10%/5%/1% anchors for percentages, keep every number in one unit, use the Rule of 70 for doubling time, and translate the answer into a business implication. Use this page as a practice sheet: read the prompt, cover the answer path, solve it on paper, then compare your setup, units, and implication.
McKinsey and BCG expect calculator-free case math, and Management Consulted sets the target at roughly 10 seconds per calculation step. If you want one scored rep before reading, start with Road to Offer math drills and come back to the shortcut that slowed you down.
What is mental math for case interviews?
Mental math for case interviews is the practice of solving multi-step business arithmetic in your head or on paper within 5-10 seconds per step, then using the answer to make a decision. The arithmetic is basic; the interview skill is choosing the right shortcut quickly, keeping units visible, and not freezing while someone watches.
If you need a broader drill bank, use mental math for case interviews. If you want 30 static prompts with worked solutions, use case interview math practice. This page focuses on which shortcut to reach for in the moment.
Which mental math shortcuts work for profitability cases?
Profitability cases are the most common case type at MBB firms, and the math is almost always margin decomposition.
The three profitability shortcuts
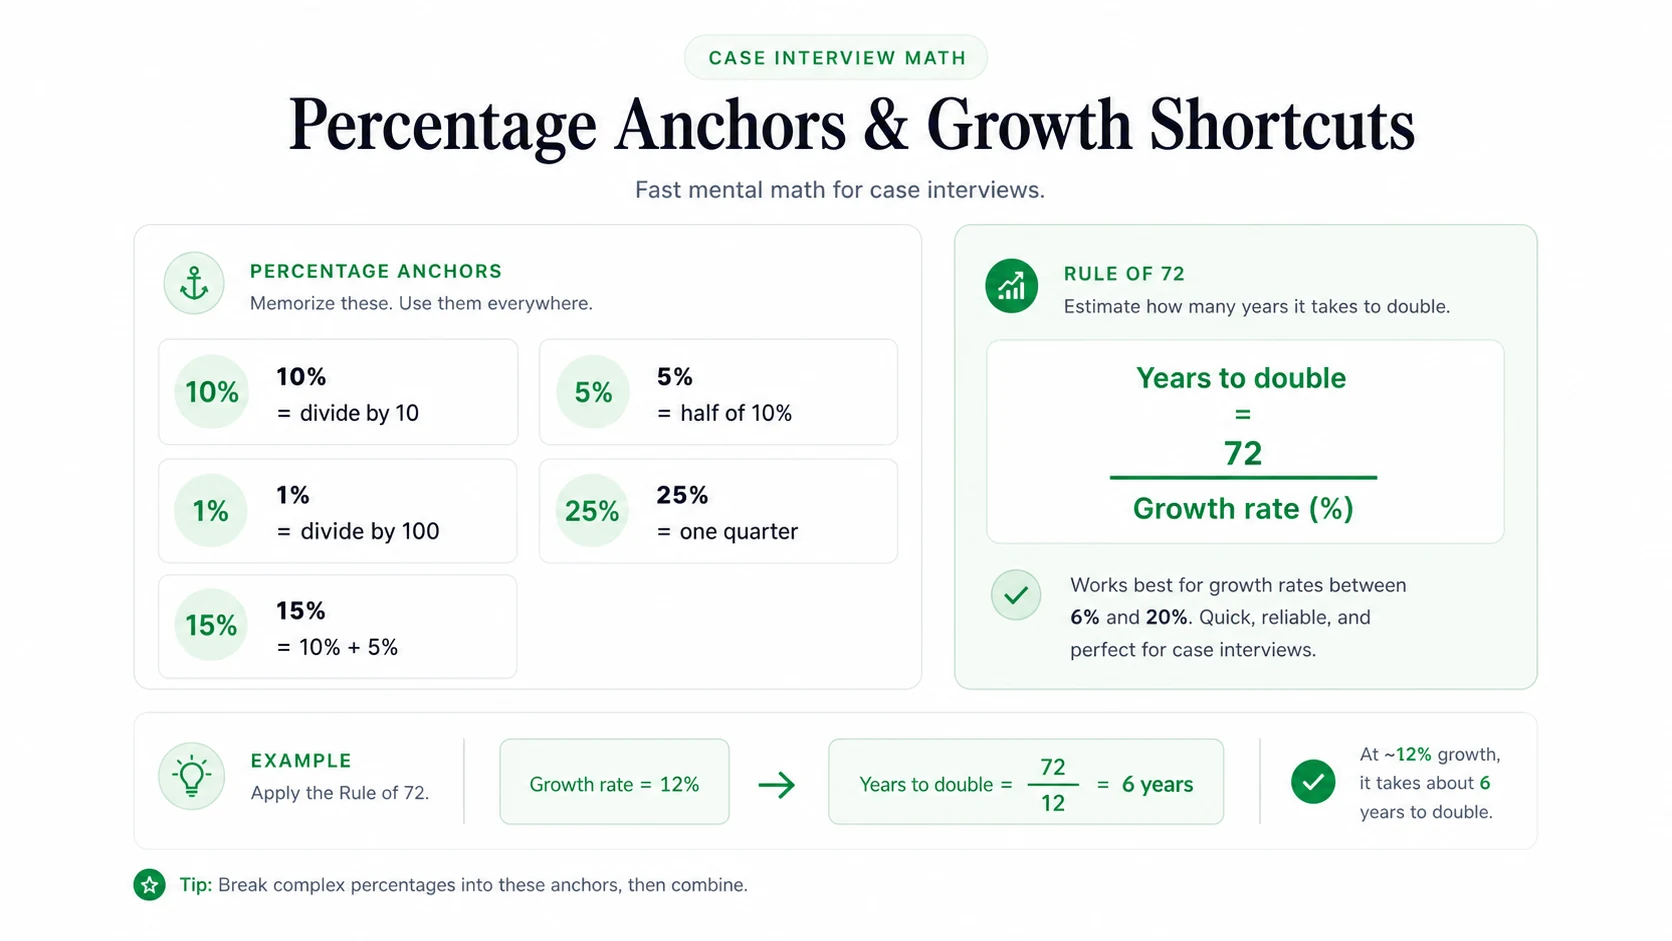
Percentage building blocks. Use this when the interviewer asks for margin dollars, cost changes, or share-of-revenue. Every calculation starts with 10%, 5%, and 1% of the base: 10% of $80M = $8M, 5% = $4M, 1% = $800K. So 16% of $80M = $8M + $4M + $800K = $12.8M.
Margin impact formula. Use this when a cost bucket changes and you need the margin effect. Profit impact = (cost change as % of cost) x (cost as % of revenue). If variable costs are 60% of revenue and you cut them by 10%, margin improves by 6 percentage points.
Mix-shift shortcut. Use this when segment mix changes. Blended margin change is approximately (revenue shift as % of total) x (margin difference). A 10% revenue shift from a 25%-margin segment to a 5%-margin segment drops blended margin by 2 points.
Worked example: profitability decline
A retailer has $200M revenue. Operating margin fell from 12% to 8% over two years.
- Shortcut: convert margin points to dollars using 1% of revenue.
- 1% of $200M = $2M.
- Margin fell 4 points, so lost operating profit = 4 x $2M = $8M.
- If SG&A rose from 30% to 34% of revenue, SG&A also moved 4 points, so it explains the full decline.
- Implication: the first branch to investigate is SG&A productivity, not pricing.
For deeper margin work, see the profitability framework guide, case interview formulas, and consulting math formulas.
How do you size markets faster with mental math?
Market sizing cases appear in roughly 1 in 4 first-round cases and are BCG's preferred opener. The math is always a chain of multiplications starting from a known population.
Anchors, chains, and zero management
Anchor numbers to memorize. Use these at the start of top-down sizing: US population 330M, households 130M, average household size 2.5, US GDP $28T, average household income $75K, US adults (18+) 260M. These save the recall pause and help you sanity-check the final market size.
Segmentation chain. Use this when demand starts from people, households, companies, or users: total base x penetration x frequency x price. Keep each step a clean multiplication, then state why the answer is plausible.
Zero management. Use this whenever numbers cross millions and billions. Write $4.5B as 4,500M, or 330M as 330 x $1M. Keep every number in the same unit through the chain.
Worked example: US coffee shop market
Estimate the annual US coffee shop market.
- Start with US adults: 260M.
- Assume half visit a coffee shop monthly: 130M customers.
- Assume 4 visits per month: 130M x 4 = 520M visits per month.
- Average spend: $5 per visit.
- Monthly revenue = 520M x $5 = $2,600M = $2.6B.
- Annual revenue = $2.6B x 12 = about $31B.
- Sanity-check: the answer is in the tens of billions, which is plausible for a large US consumer category. If an interviewer pushes, the likely undercount is visit frequency.
For the full setup logic, use the market sizing step-by-step guide. If the arithmetic feels fine but assumptions feel loose, practice with market sizing questions.
When should you use the Rule of 70 in growth cases?
Growth cases ask you to project future revenue, evaluate market growth, or size investment to hit a growth target. The math centers on compound growth.
Rule of 70 and CAGR estimation
Rule of 70. Use this when a market, revenue stream, or user base grows at a steady compound rate. Doubling time is approximately 70 / growth rate. 7% doubles in 10 years, 10% in 7 years, 14% in 5 years, 35% in 2 years. It works in reverse: a market that doubled in 5 years has an implied CAGR of about 14%.
Quick CAGR estimation. Use this for small changes over short time horizons. Revenue from $100M to $130M in 3 years gives roughly 30% / 3 = 10% CAGR. The linear shortcut works best for growth rates below 15% and time horizons under 7 years.
Worked example: SaaS investment sizing
A SaaS company has $50M ARR growing at 25% annually. The board wants $200M.
- $50M to $200M is 4x, or two doublings.
- Rule of 70: 70 / 25 = 2.8 years per doubling.
- Two doublings take about 5.6 years.
- Incremental ARR needed = $200M - $50M = $150M.
- At $50K average contract value, new customers needed = $150M / $50K = 3,000 customers.
- At $15K CAC, acquisition spend = 3,000 x $15K = $45M.
- Implication: the growth target is mathematically plausible at the current CAGR, but only if the company can fund roughly $45M of acquisition and maintain payback quality.
For more growth case patterns, see case interview frameworks.
What pricing math do interviewers test?
Pricing cases evaluate price changes, elasticity effects, and break-even decisions. The math centers on how price and volume interact.
Break-even and revenue impact formulas
Break-even volume change. Use this when price changes and the interviewer asks how much demand can fall before profit declines. Raise price by X% on a product with Y% contribution margin, and the maximum volume loss is X / (Y + X). A 10% price increase on a 40% contribution margin product tolerates up to 10 / 50 = 20% volume decline.
Revenue impact shortcut. Use this when price and volume both move. New revenue = Old x (1 + price change %) x (1 + volume change %). For mental math, add the two changes and include the interaction term. Price up 8%, volume down 3% gives +8% - 3% - 0.24% = about +4.8% revenue.
Worked example: 15% price increase
A consumer brand has $120M revenue, 30% contribution margin, and is considering a 15% price increase that will cut volume by 10%.
- Revenue shortcut: +15% price - 10% volume - 1.5% interaction = +3.5% revenue.
- New revenue = $120M x 1.035 = about $124M.
- Profit break-even check: 15 / (30 + 15) = 15 / 45 = 33% maximum tolerable volume loss.
- Actual expected loss is 10%, well below 33%.
- Implication: the price increase should improve profit unless the volume loss is concentrated in strategic customers or high-margin segments.
For formula recall, pair this with case interview formulas. For execution speed, use case interview math practice.
Which shortcut for which case?
What are the most common mental math mistakes?
Run one scored math rep
Enter the answer, show the formula and units, and get feedback on whether the setup would hold up in a live case.
How do you build mental math speed before your interview?
Speed comes from automatic recall, not raw arithmetic talent. The shortcuts only work if you do not have to think about which to use. Practice by case type: if margin math is slow, drill percentages and profitability; if sizing chains stall, drill population estimations and zero management; if pricing math breaks, drill price-volume and break-even.
Use this 15-minute loop:
- Run one scored math drill and write down the miss pattern.
- Redo the closest worked example on this page without looking.
- Do five paper reps from case interview math practice.
- Close with one implication sentence after every answer.
Most candidates need 3-4 weeks of daily 15-20 minute drills before shortcut recall feels automatic.
Practice case math shortcuts from the Road to Offer drill engine: a real prompt, your answer, and AI-scored feedback. Free account includes free daily drills.
Five warm-up prompts
Use these as paper reps before a mock interview. Say the shortcut, answer, units, and implication out loud.
For a deeper mechanics walkthrough, use mental math for case interviews. For formula recall, use case interview formulas and consulting math formulas.
Sources and Further Reading (checked June 17, 2026)
- McKinsey case interview preparation (calculator policy, paper math): https://www.mckinsey.com/careers/interviewing
- BCG case interview preparation: https://careers.bcg.com/global/en/case-interview-preparation
- Bain interview prep: https://www.bain.com/careers/interview-prep/
- Management Consulted case interview math (10-second standard, Rule of 72): https://managementconsulted.com/case-interview-math/
- IGotAnOffer market sizing guide (benchmark numbers): https://igotanoffer.com/blogs/mckinsey-case-interview-blog/market-sizing
- PrepLounge market sizing framework: https://www.preplounge.com/en/case-interview-basics/market-sizing
- Hacking the Case Interview, mental math strategies: https://www.hackingthecaseinterview.com/pages/case-interview-mental-math
- US Census Bureau, 2024 population estimates (340.1M): https://www.census.gov/library/stories/2024/12/population-estimates.html
- World Bank Open Data: https://data.worldbank.org/
Make mental math automatic
Run timed case math reps with feedback on setup, units, accuracy, and the business implication.
Frequently asked questions
Resources and related guides
- Drill profitability mathPractice
- Browse all free resourcesResource hub
- Case Interview Math Practice: 30 Drills, Questions, and SolutionsMath And Quant · Feb 6, 2026
- Case Interview Math Tips: A Calm, Repeatable ProcessMath And Quant · May 1, 2026
- Guesstimate Questions: 10 Examples + Answers (2026)Math And Quant · Mar 20, 2026
- Market Sizing Framework: Top-Down vs Bottom-Up, Step by Step (2026)Math And Quant · Feb 1, 2026