Fintech Case Interview: Payments, Neobanks, Lending & Crypto (2026)
Master fintech case interviews with worked numbers: payment take rate, neobank profitability, lending default math, and crypto strategy. Frameworks plus full examples.
On this page
Most candidates preparing for financial services cases study branch consolidation and loan portfolio management. That is still useful, but it is no longer enough for the technology-heavy work these firms increasingly sell. Fintech cases can cover digital payments, neobank growth strategy, lending platform profitability, and crypto infrastructure. If you interview for a financial services or technology practice in 2026, prepare to discuss fintech economics when the prompt points there.
How Do You Open a Fintech Case?
Coaches at every major prep site agree on the same first move, and it is the step most candidates skip. Before you draw a single branch of your structure, do two things.
1. Validate the business model. Confirm out loud how this company makes money. A payment processor earns a thin take rate on volume. A neobank earns interchange plus net interest margin on deposits. A lender earns the spread between interest income and cost of funds, net of defaults. Get this wrong and your structure points at the wrong objective.
2. Lock the success metric. Ask what "good" means here: breakeven in 18 months, a target margin, defensible share, or sustainable unit economics. Know the destination before you pick a route.
Only then build a structure. This sequence matters more in fintech than in a generic profitability case because the business models are unfamiliar, and an interviewer can tell within thirty seconds whether you understand how the company earns a dollar or whether you are pattern-matching.
The 4 Fintech Case Types You Will Face
Fintech is broad. In case interviews, the prompts cluster into four categories, each requiring different frameworks and knowledge.
The rest of this guide breaks down frameworks and worked examples for each.
Digital Payments: How Does a Processor Actually Make Money?
Payments is one of the largest fintech verticals: enormous volume, thin margins. Interviewers expect you to understand where the cents land. Every card transaction involves four parties: the cardholder, the merchant, the issuing bank (cardholder's bank), and the acquiring bank (merchant's bank). The processor (Stripe, Adyen, Square) sits between the merchant and the acquirer, while Visa and Mastercard provide the network rails connecting issuers and acquirers.
Key economics:
- Merchant discount rate (MDR): The total fee the merchant pays per transaction, typically 1.5-3.5% of value.
- Interchange fee: The largest component of MDR, paid by the acquirer to the issuer, typically 1.5-2.0% for credit and 0.2-0.5% for regulated debit.
- Network fee: Paid to Visa/Mastercard, typically 0.13-0.15%.
- Processor margin (take rate): MDR minus interchange minus network fee, often only 0.3-0.8% of value.
Worked Micro-Example: Following One $100 Transaction
This is the calculation that separates candidates who understand payments from those who recite acronyms. Walk a single $100 credit-card purchase through the chain:
- Merchant pays a 2.40% MDR, so total fees are $2.40. The merchant nets $97.60.
- Of that $2.40, interchange to the issuing bank is about 1.80%, or $1.80.
- The network (Visa/Mastercard) assessment is about 0.14%, or $0.14.
- The processor keeps the remainder, $2.40 - $1.80 - $0.14 = $0.46, a take rate of 0.46%.
So on a 2.40% headline MDR, the processor's actual revenue is $0.46 per $100, roughly one fifth of the sticker fee. The issuer, who took the credit risk and funded the rewards, keeps the largest slice.
Framework for a payments case: size the market by transaction volume and value; model revenue as take rate times TPV by merchant segment (SMBs pay 2.5-3.5% MDR versus 1.5-2.0% for enterprises); build the cost structure (infrastructure, compliance, fraud losses of 0.05-0.1% of TPV, merchant acquisition); assess competitive dynamics (switching costs, network effects, PSD2 opening Europe to entrants); then evaluate growth levers (geographic expansion, BNPL and real-time rails, embedded lending).
Neobank Growth: From Signup to Profitability
Neobank cases test the full growth funnel, not just how to get users but how to convert free users into profitable ones. Most neobanks are still unprofitable, and the standard path requires moving beyond free debit cards into lending, premium subscriptions, or interchange revenue at scale.
Neobank unit economics (typical ranges):
- Customer acquisition cost (CAC): $5-50 depending on channel and geography.
- Activation rate (user actually deposits funds): 30-60% of signups.
- Average revenue per user (ARPU): $30-80/year for basic accounts, $150-300/year for premium.
- Net interest margin on deposits: 2-4%.
- Interchange revenue per active user: $20-40/year (on average spend of $8,000-15,000/year).
A point most candidates miss: neobank revenue follows a power law, where the top 10-15% of users generate 60-70% of revenue, so treating all users identically misses what drives the business. For the underlying decomposition, see the profitability framework and the customer profitability case interview guide.
Lending Platform Profitability: Risk-Adjusted Thinking
Lending cases force you to think about risk in a way other case types do not. Revenue is straightforward (interest income plus origination fees), but profitability depends entirely on default rates, which are easy to get wrong.
Key lending metrics:
- Net interest margin (NIM): Interest earned minus cost of funds, typically 2-6% for digital lenders versus 1-2% at traditional banks.
- Default rate: Share of loans that go unpaid, typically 2-5% for prime, 8-15% for subprime.
- Loss given default (LGD): For unsecured personal loans, typically 60-80% of the balance.
- Cost of acquisition per funded loan: $200-800 depending on channel and loan type.
Worked Micro-Example: The Risk-Adjusted Loan
Take a $10,000 unsecured personal loan at 15% interest with a 6% cost of funds:
- Gross interest spread (NIM): (15% - 6%) x $10,000 = $900.
- Expected loss: 4% default rate x 80% LGD x $10,000 = $320.
- Servicing and acquisition (amortized): roughly $250.
- Net contribution per loan: $900 - $320 - $250 = $330.
Now loosen credit to double volume, and suppose the default rate climbs from 4% to 9%:
- Expected loss: 9% x 80% x $10,000 = $720.
- Net contribution per loan: $900 - $720 - $250 = -$70.
Volume doubled, but each new loan now loses money. Total portfolio profit can fall even as the loan book grows. This is the trap.
Framework for a lending case: model revenue (loan volume x interest rate plus 1-5% origination fees); quantify credit risk (default rate x loan size x LGD); compute unit economics per loan (interest income minus cost of funds minus expected loss minus servicing); roll up to portfolio profitability minus fixed costs; then layer regulatory constraints (capital requirements, APR caps, consumer protection).
Worked Case: Neobank Profitability Turnaround
Prompt: "A European neobank has 3.2 million registered users and is burning $55 million per year. The CEO wants breakeven within 18 months without raising another round. How would you approach this?"
Structure: "Three dimensions: revenue optimization (more value from existing users), cost reduction (where the $55M goes and what is discretionary), and user economics (the distribution of user value, and whether we over-invest in low-value users)."
Key analysis (with numbers). The interviewer shares: 3.2M registered, only 1.1M active (34% activation), ARPU of $42/year on active users. Cost breakdown: $28M technology, $12M acquisition, $8M compliance, $7M support.
- Revenue: 1.1M x $42 = $46.2M
- Costs: $28M + $12M + $8M + $7M = $55M
- Actual loss: $8.8M/year, not the $55M the framing implied (since $55M is total cost, not net loss)
The burn framing is misleading: the company loses $8.8M on $46.2M revenue, roughly 19% from breakeven. That calls for targeted improvements, not a pivot.
Three levers to close the $8.8M gap:
- Lift activation from 34% to 45%: adds about 352K active users x $42 = +$14.8M revenue, via better onboarding (first-deposit nudges, simplified KYC).
- Cut acquisition spend 40%: $12M down to $7.2M = $4.8M saved, shifting from paid channels to referral.
- Launch a $8/month premium tier: if 5% of active users convert, 55K x $96/year = +$5.3M revenue.
Any two of the three closes the gap. All three creates a $16M buffer.
Recommendation: "The neobank is 19% from breakeven, not in crisis. I would prioritize activation, the highest-ROI lever because it monetizes users already acquired, paired with acquisition-cost reduction. Those two alone should reach breakeven inside 12 months, ahead of the 18-month target. The premium tier is a medium-term diversification play."
Worked Case: Crypto Strategy for a Traditional Bank
Prompt: "A mid-size US bank ($45B in assets) is considering a stablecoin for B2B cross-border payments. The CEO believes it could cut correspondent banking costs by 60%. Should they proceed?"
Structure: "Four areas: market opportunity (size of the B2B cross-border flow they could capture), cost advantage (does a stablecoin truly deliver the 60%), regulatory risk (licensing and compliance), and competitive timing (too early, too late, or well-timed)."
Key analysis. The interviewer shares: the bank processes $8B annually in cross-border B2B payments. Correspondent banking costs average 1.5% of value ($120M/year). Stablecoin settlement is estimated at 0.3-0.5%.
- Current cross-border cost: $8B x 1.5% = $120M/year
- Stablecoin estimated cost: $8B x 0.4% = $32M/year
- Potential savings: $120M - $32M = $88M/year (73% reduction, above the CEO's 60% claim)
- Build cost: estimated $15-25M
- Naive payback: $20M build / $88M savings = under 3 months (unrealistically fast, a flag for hidden costs)
The raw math looks compelling, but the 3-month payback is a flag. Hidden costs include regulatory licensing ($5-10M, 12-18 months), core-banking integration ($10-20M), counterparty onboarding (clients must adopt the stablecoin), and ongoing compliance. A realistic timeline is 2-3 years to breakeven.
Recommendation: "Proceed as a pilot, not a full launch. Start with the 3-5 largest corridors (about $2B of the $8B), build on an existing stablecoin protocol rather than a proprietary one, and target roughly $22M in annual savings on the pilot. Use it to prove the cost model and clear the regulatory process before scaling. The risk of waiting is that fintech competitors capture this flow first."
Fintech-Specific Frameworks: Beyond the Basics
Standard case interview frameworks work as starting points, but fintech cases reward additional analytical layers on top.
Framework
Fintech Case Analysis Framework
- 01
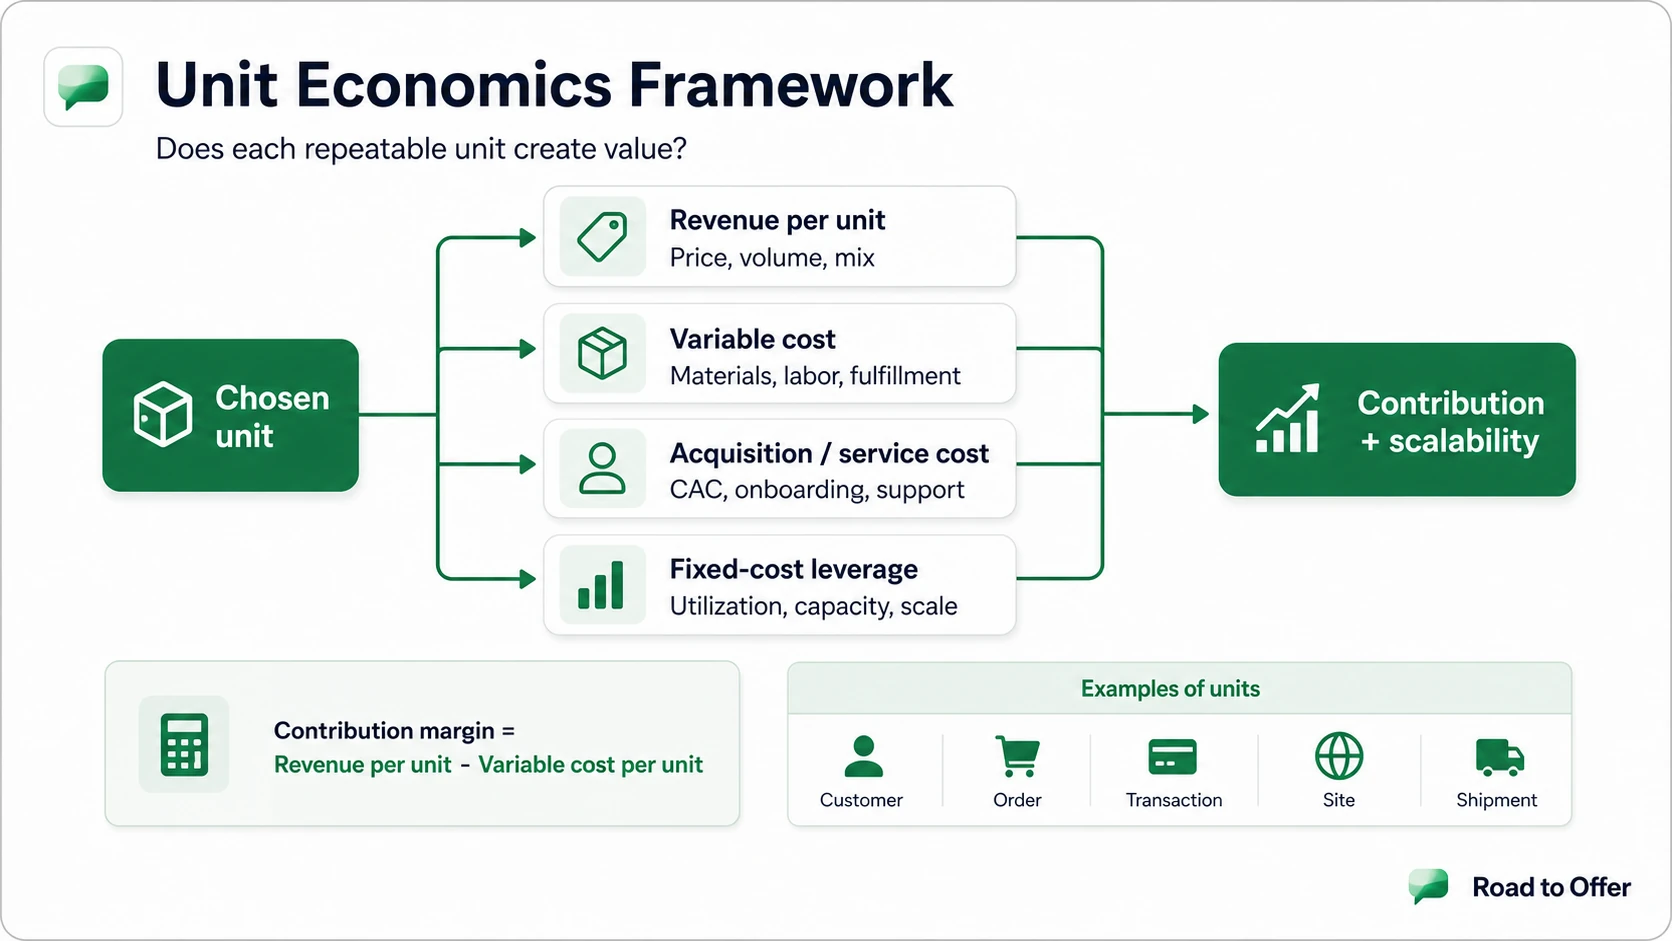
Business Model Economics
Revenue model (interchange, NIM, subscription, transaction fees). Unit economics per customer or transaction. Driver: volume or margin?
- 02
User Funnel Analysis
Acquisition → Activation → Retention → Monetization → Referral. Where is the funnel leaking, and what is the cost at each stage?
- 03
Regulatory Landscape
Licensing, capital adequacy, consumer protection, data privacy (GDPR/CCPA). Can the client operate legally in target markets?
- 04
Platform Dynamics
Network effects (direct or indirect), multi-homing risk, switching costs, data moats. Does scale create a defensible advantage?
- 05
Technology Build vs. Partner
Core differentiator = build. Commodity capability = partner or buy. Regulatory requirement = license. Speed vs. control trade-off.
Payments cases lean on Layers 1 and 4, neobanks on Layers 1 and 2, lending on Layers 1 and 3, crypto on Layers 3 and 5. The difference is specificity: a generic profitability framework underperforms one built on these digital layers, because the interviewer can tell whether you understand the business model or are guessing. For technology-adjacent frameworks, see the digital transformation case interview guide.
Which Firms Run Fintech Cases?
Two different worlds give fintech cases, and they test differently.
Strategy consulting (firm-agnostic structure). McKinsey, BCG, Bain, Oliver Wyman, Accenture Strategy, the Big 4 strategy practices, Simon-Kucher, and L.E.K. all field financial-institutions or digital-banking work. Their fintech prompts use the standard structure-then-quant approach layered with the economics above. Oliver Wyman in particular leans math-heavy and may add a written or modeling component, so the arithmetic in this guide matters most there.
In-house at fintech and lending companies (quant-heavy). Payment networks and lenders like Capital One, Visa, and PayPal run their own case interviews, spending far more time on quantitative problems than a typical MBB case, often built directly around credit risk and unit economics. Drill the lending and payments math until it is automatic. The finance case interview guide covers these quant-forward formats, and the private equity case interview guide covers the diligence angle when a fund evaluates a fintech target. It is also a strong target for career changers from banking, payments, or product, where domain familiarity is a genuine edge if paired with clean structure.
Key Fintech Metrics: The Numbers You Must Know
Walk into a fintech case knowing these ranges so you can sanity-check the data an interviewer provides. Unrealistic assumptions signal weak preparation.
For drilling these calculations under time pressure, see the case interview math practice guide.
Common Fintech Case Mistakes
- Skipping the business-model check. Jumping into a structure before confirming how the company earns a dollar is the most common error. Validate the model and lock the success metric first.
- Confusing revenue with margin in payments. A 2.4% MDR might yield only a 0.46% take rate; treating MDR as revenue collapses the analysis.
- Treating all users as equal in neobank cases. The top 10-15% of users typically drive 60-70% of revenue, so ignoring the distribution misses what drives the business.
- Optimizing lending volume without adjusting for risk. Doubling volume by loosening credit can flip per-loan economics negative. Re-check the default rate whenever volume grows.
- Ignoring regulatory feasibility. A lender cannot enter a new market without licensing, and a crypto product cannot launch without compliance infrastructure. Fintech is heavily regulated, often more scrutinized than incumbents, so always include a regulatory bucket.
Related Guides
- Financial services case interview: banking, insurance, and capital markets cases where fintech intersects traditional FS
- Insurance case interview: combined-ratio economics and the insurtech disruption angle that fintech cases increasingly touch
- Digital transformation case interview: build-vs-buy frameworks and technology strategy cases
- Technology case interview: platform economics and SaaS unit economics that overlap with fintech strategy
- Pricing strategy cases: value-based and competitive pricing for fintech products and interchange models
- Profitability framework: the financial decomposition skills underlying all fintech unit economics
Sources and Further Reading (checked June 18, 2026)
- myConsultingOffer, Financial Services Case Interview: https://www.myconsultingoffer.org/case-study-interview-prep/financial-services-case-interview/
- Hacking the Case Interview, Financial Services Case Interview: https://www.hackingthecaseinterview.com/pages/financial-services-case-interview
- PrepLounge, Payment/Fintech cases forum: https://www.preplounge.com/consulting-forum/paymentfintech-cases-23882
- Unit, The Ultimate Guide to Interchange Revenue: https://www.unit.co/guides/ultimate-guide-interchange-revenue
- Federal Reserve, Interchange Fees and Payment Card Networks: https://www.federalreserve.gov/pubs/feds/2009/200923/index.html
- IGotAnOffer, Capital One Case Interview: https://igotanoffer.com/blogs/mckinsey-case-interview-blog/capital-one-case-interview
FAQ