Energy Case Interview: Oil & Gas Framework, Worked Example, and Prep Guide (2026)
Energy case interviews need a different cost structure map: upstream/midstream/downstream value chain, key metrics, and energy transition frameworks.
On this page
Energy case interviews test whether you can navigate a fundamentally different cost structure than standard consulting cases. Energy consulting is a large, specialized advisory market, and energy-focused practices use sector cases to screen for candidates who understand why a midstream pipeline business and an upstream drilling operation require completely different analytical frameworks.
Why Energy Cases Are Different from Standard Consulting Cases
A standard profitability framework case treats a business as a single revenue and cost structure. Energy cases don't work that way. A vertically integrated oil major like ExxonMobil or Shell operates three fundamentally different businesses under one roof, and each has its own revenue model, cost structure, margin profile, and commodity price sensitivity.
Applying a single profitability tree to an energy company without first segmenting by value chain is the fastest way to lose an energy interviewer's confidence.
Three structural differences separate energy cases from standard consulting cases:
1. Commodity price volatility is a first-order variable. In most industries, price is somewhat within the firm's control. In upstream oil and gas, revenue tracks commodity prices nearly 1:1. A $10/barrel shift in the oil price can swing a major upstream operator's operating profit by billions of dollars. Your analysis must account for price scenarios, not just a single revenue figure.
2. CapEx cycles dominate strategy. Upstream projects require 5-10 years of capital investment before generating revenue. An energy company's strategic decisions today (drill here, build this pipeline, acquire this asset) create revenue and cost constraints for a decade. Most consulting cases involve operational decisions with 1-3 year paybacks; energy strategy often involves decisions with 10-20 year horizons.
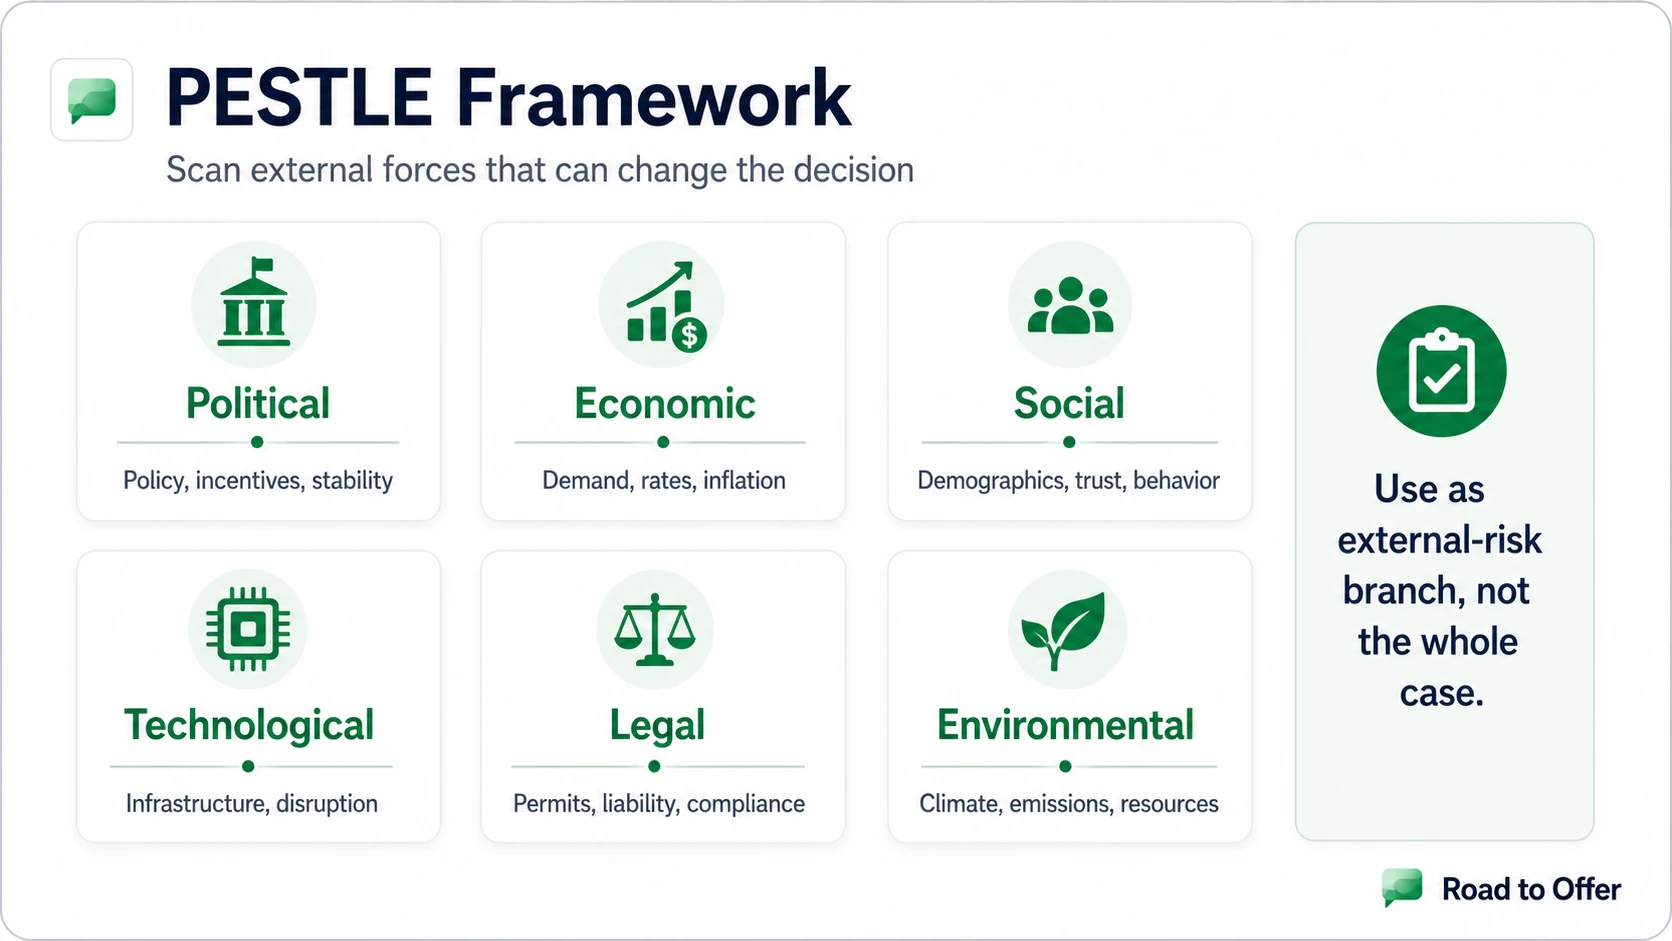
3. The energy transition adds a second strategic layer. Many energy clients now manage a dual mandate: optimize the existing hydrocarbon business while evaluating renewables and low-carbon alternatives. Energy cases may include a transition dimension (where to allocate capital across legacy and new-energy assets) that requires a separate analytical lens.
The Three-Segment Value Chain: Upstream, Midstream, Downstream
Before touching any energy case framework, you must segment the value chain. Here is the segment-by-segment cost structure with directional margin benchmarks, the table many candidates are missing when they walk into energy interviews.
Upstream: The High-Stakes Exploration Business
Upstream is where hydrocarbons are found and produced. The key cost drivers are:
- Finding and development (F&D) costs: The capital cost to discover and bring a barrel of oil or MCF of gas to production. Tracked as $/BOE (barrels of oil equivalent). Best-in-class shale operators achieve F&D costs below $10/BOE; deepwater projects often run $25-40/BOE.
- Lifting costs (OPEX per barrel): The operating cost to produce each barrel once the well is drilled. Shale: $5-15/BOE. Deepwater: $15-25/BOE. Middle East conventional: $3-8/BOE.
- Decline rates: Shale wells decline 60-70% in their first year of production, requiring constant new drilling to maintain flat production. Conventional reservoirs decline 5-10% annually.
- Breakeven price: The all-in oil price (including CapEx recovery) at which a project generates zero economic return. US shale: $40-55/barrel. Deepwater: $45-65/barrel. Middle East conventional: $8-20/barrel.
Midstream: The Fee-Based Infrastructure Business
Midstream assets (pipelines, processing plants, storage terminals, LNG facilities) earn fees for moving and handling energy, not for owning the commodity. Key metrics:
- Throughput volume: Barrels or MCF per day moving through the system
- Tariff rates: $/barrel or $/MCF fee per unit of throughput
- Utilization rate: What percentage of pipeline or terminal capacity is being used
- Contract coverage: What percentage of revenue is locked in under long-term take-or-pay contracts
High contract coverage + high utilization = stable, high-margin cash flows. This is why midstream assets are often valued like infrastructure or utilities, not like commodity businesses.
Downstream: The Margin-Thin Refining and Retail Business
Downstream converts crude oil into refined products (gasoline, diesel, jet fuel, petrochemicals). Revenue is driven by the crack spread: the difference between what refiners pay for crude and what they receive for refined products.
- Crack spread: Typically $5-20/barrel depending on crude quality and product mix. A 3-2-1 crack spread (3 barrels of crude → 2 barrels gasoline + 1 barrel diesel) is the standard benchmark.
- Refinery complexity: Nelson Complexity Index measures how much heavy or sour crude a refinery can process. Higher complexity = higher margins but also higher CapEx.
- Utilization rate: Refineries running at 90%+ utilization are more profitable on a per-barrel basis due to fixed cost leverage.
Downstream is the segment where many energy companies are cutting capital allocation in favor of upstream or renewables, a trend that creates its own case interview opportunities around portfolio rationalization.
The Renewable Energy Transition Framework
The energy transition is not just a background trend in energy cases. It can be a primary case driver. Many major energy clients are managing capital allocation across legacy hydrocarbon assets and new-energy investments simultaneously.
Framework
Energy Transition Strategic Framework
- 01
1. Portfolio Assessment
Map existing assets by segment (upstream/midstream/downstream) and by carbon intensity. Identify which assets are stranded-asset risks at various carbon price or oil price scenarios.
- 02
2. Transition Pathway Options
Three archetypes: (a) Defend and optimize legacy assets; (b) Pivot aggressively to renewables; (c) Hybrid: monetize legacy cash flows to fund new-energy CapEx.
- 03
3. Capital Allocation Logic
At what oil price does the legacy business generate sufficient free cash flow to fund transition investment? Model 3 scenarios: $60, $75, $90/barrel.
- 04
4. Execution Risk
Renewable assets require different capabilities (project finance, grid interconnection, power purchase agreement negotiation) that oil majors often lack. Build vs. buy vs. partner decision.
- 05
5. Recommendation
Quantify: how much capital in legacy optimization vs. transition, over what time horizon, with what financial return threshold.
When an energy case includes a transition angle, do not treat it as a separate strategic question. Integrate it into the capital allocation analysis. The answer to "should our client invest in offshore wind?" is inseparable from "what is the free cash flow profile of their existing upstream assets over the next 10 years?"
Five Common Energy Case Types
1. Profitability Cases
One of the most common energy case types. A segment is underperforming. Structure: Segment first (which part of the value chain?), then isolate volume vs. price vs. cost within that segment.
2. Capacity and CapEx Allocation Cases
Should a client build new production capacity, expand a pipeline, or add refinery complexity? Structure: Current utilization rate → projected demand → cost of new capacity → NPV at multiple commodity price scenarios.
3. Market Entry Cases
Should a client enter a new geography, segment, or energy type? Use the market entry framework but add an energy-specific layer: regulatory regime (royalty rates, environmental permitting), infrastructure availability (pipeline access, grid connectivity), and commodity price breakeven for the new opportunity. See also the M&A case framework for acquisition-based entry.
4. M&A and Portfolio Cases
Should a client acquire an upstream asset, sell a midstream business, or divest its downstream retail network? Structure: Strategic fit → Valuation (EV/EBITDA multiple is the standard metric; oil and gas assets also trade on EV/BOE or $/barrel of daily production) → Integration or separation complexity → Risk.
5. Operations and Cost Reduction Cases
Where can the client reduce CapEx or OPEX without sacrificing production or throughput? Common levers: procurement optimization, maintenance cost rationalization, digital monitoring to reduce unplanned downtime, supply chain consolidation. See the operations cost framework and cost reduction guide for analytical structure.
Key Metrics You Must Know
These metrics appear repeatedly in energy cases. Not knowing them can signal industry unfamiliarity to interviewers in energy or natural resources practices.
Worked Example: Refinery Profitability Case with Numbers
Prompt: "Your client operates a mid-complexity refinery in the US Gulf Coast with throughput capacity of 200,000 barrels per day. EBITDA margin has dropped from 8% to 4% over the last 18 months despite stable crude oil prices. The refinery has been running at 85% utilization. What's driving the margin decline and what would you recommend?"
Opening clarification: "Before I structure this, I want to confirm: has crude cost been stable in absolute terms or relative to competitor benchmarks? And is the 4% EBITDA margin at a similar utilization rate to 18 months ago, or has utilization declined as well?"
[Interviewer: Crude costs are in line with market. Utilization was 91% 18 months ago and is now at 85%.]
Structuring the problem:
"Good. I'm working with two changes: utilization dropped 6 percentage points and EBITDA margin dropped 4 points. Let me quantify what that means first.
At 200,000 bbl/day capacity and $80/barrel crude:
- 18 months ago: 200,000 × 91% = 182,000 bbl/day throughput
- Today: 200,000 × 85% = 170,000 bbl/day throughput
- That's 12,000 bbl/day less throughput, roughly $960,000/day in lost revenue at an assumed $80 crack spread equivalent revenue
At 8% margin on prior revenue base: the margin decline from 8% → 4% on the current throughput base suggests roughly $300M+ annual EBITDA impact.
Let me frame this as three possible drivers:
- Crack spread compression: the spread between crude input and refined product output has narrowed
- Fixed cost deleverage: lower utilization means fixed costs (labor, maintenance, depreciation) spread over fewer barrels
- Yield or quality degradation: the refinery is producing a less valuable product mix than before
My hypothesis is that it's primarily fixed cost deleverage from the utilization drop, amplified by some crack spread compression. I'd want to check: what's driving the 6-point utilization drop? Is it unplanned downtime, maintenance turnarounds, or reduced crude supply?"
[Interviewer: The utilization drop is about 40% unplanned downtime from equipment failures and 60% reduced crude throughput due to a supply disruption from one crude supplier that was not replaced.]
Recommendation:
"That's two distinct problems: operational reliability and supply diversification.
On operational reliability: unplanned downtime is almost always more expensive than scheduled maintenance. If equipment failures are causing even 2,400 bbl/day of lost production (a conservative 20% of the utilization gap), at an $8 crack spread that's roughly $19,200/day or $7M/year in lost margin per percentage point of unplanned downtime. I'd recommend a root cause analysis on the failure mode. If it's a specific piece of equipment (heat exchangers, hydrotreaters, and crude units are the most common failure points), the capital investment to upgrade or redundant-specify that equipment likely pays back in under 24 months at these margins.
On supply diversification: the refinery is clearly too concentrated in a single crude supplier. The standard industry practice for a 200,000 bbl/day refinery is 3-5 crude supply contracts to prevent exactly this disruption. I'd recommend immediately engaging 2 alternative suppliers for spot cargoes to restore utilization, then converting at least one to a term contract.
The combined effect: restoring utilization to 91% recovers approximately $70-80M in annual EBITDA based on the fixed cost leverage math. The recommendation is operationally fix first, commercially diversify in parallel. Both actions are executable within 90 days."
This is the structure energy interviewers reward: clear segmentation, quantification at every step, two distinct root causes addressed separately, and a recommendation with specific financial recovery logic.
Which Firms Give Energy Cases (and When)
For firm-specific interview formats, see the Deloitte case interview guide, McKinsey case interview guide, and BCG case interview guide. For target-list building, compare the top energy consulting firms.
Energy cases also appear in interviews at management consulting firms that are not primarily energy-focused. If your resume includes energy sector experience (upstream operations, utilities, renewables project management), expect interviewers to probe that background with sector-specific cases even at firms like Bain or Accenture. Review the management consulting firms ranking guide for broader market context.
30-Day Energy Case Prep Plan
Checklist
Execution checklist
Days 1-5: Learn the value chain, upstream, midstream, downstream cost structures and margin benchmarks
You cannot structure an energy case correctly without this. Memorize the segment EBITDA margin ranges and key cost drivers before practicing any cases.
Days 1-5: Learn 8 key energy metrics (BOE, F&D cost, crack spread, EV/EBITDA, decline rate, breakeven price, RLI, utilization rate)
These terms appear in every energy case. Not knowing them signals lack of preparation immediately.
Days 6-12: Practice 3-4 profitability cases using the value chain segmentation first
Profitability is a recurring energy case type. Train the habit: segment first, then apply profitability framework within the relevant segment.
Days 6-12: Learn the energy transition framework and practice integrating it into capital allocation cases
Transition questions are common enough in senior energy strategy cases that you should be ready to state a clear capital allocation recommendation across legacy and new-energy assets.
Days 13-20: Practice market entry and M&A energy cases (3-4 cases)
Geographic expansion and asset acquisition are recurring energy case themes at firms with large energy practices.
Days 13-20: Practice quantitative energy math: CapEx recovery at 3 commodity price scenarios, utilization impact on fixed cost absorption
Energy cases require more quantitative fluency than typical strategy cases. Practice building quick NPV logic and commodity price sensitivity tables mentally.
Days 21-30: Full mock interviews with energy sector context (2-3 complete cases)
Simulate the full case arc: clarifying questions, segmentation, hypothesis, analysis, recommendation. Test your ability to handle interviewer pushback on price assumptions or market share projections.
Days 21-30: Read one major energy consulting firm's annual energy outlook (Deloitte, McKinsey, IEA)
These reports give you current facts (transition investment trends, price forecasts, demand projections) that demonstrate genuine industry knowledge in fit conversations.
For the broader case interview prep timeline, see the consulting interview prep timeline guide.
Common Mistakes in Energy Case Interviews
Not segmenting before structuring. Applying a generic profitability tree to an energy company without first identifying which segment (upstream/midstream/downstream) has the problem. Interviewers notice immediately.
Ignoring commodity price scenarios. In energy cases, a single revenue or profit figure without reference to the commodity price assumption is analytically incomplete. Always specify: "at $75/barrel," "assuming current crack spreads hold," or similar.
Treating the energy transition as an afterthought. Transition questions can be primary strategic drivers, not bonus topics. Candidates who dismiss the renewables dimension as "out of scope" can miss an important strategic layer for senior-level energy cases.
Confusing upstream and midstream economics. Stating that pipeline businesses are exposed to commodity price risk signals a basic knowledge gap. Know the difference between asset-based commodity exposure (upstream) and fee-based contract revenue (midstream) cold.
For additional technique tips, see case interview tips and mistakes and case interview synthesis guide. For related framework cases, the supply chain case interview guide covers operational diagnostics that overlap with midstream and downstream energy cases.
Related Industry Cases
Energy cases intersect with several adjacent sectors. The ESG sustainability case interview covers decarbonization strategy and carbon pricing, which appear as an overlay in nearly every upstream and utility case post-2024. The supply chain case interview applies to midstream logistics, crude transport, and LNG distribution cases where SIMDC node analysis maps directly onto pipeline and terminal operations. The TMT case interview is useful when energy clients are deploying smart grid software, IoT-driven predictive maintenance, or digital oilfield platforms. The real estate case interview overlaps for cases involving energy infrastructure asset valuation, site acquisition for renewables, or sale-leaseback of refinery assets.
Sources and Further Reading (checked June 17, 2026)
- Grand View Research, Energy Consulting Market Size and Forecast 2025-2034: https://www.grandviewresearch.com/industry-analysis/energy-consulting-market
- Deloitte Energy & Industrials, Energy Revenue and Market Share (2023): https://www.deloitte.com/us/en/industries/energy/about.html
- McKinsey Oil, Gas & Electric Power Practice, Revenue Data: https://www.mckinsey.com/industries/oil-and-gas/our-insights
- IEA World Energy Outlook 2024, Power Generation Market Share: https://www.iea.org/reports/world-energy-outlook-2024
- EIA, US Refinery Utilization and Crack Spread Data: https://www.eia.gov/petroleum/refinerycapacity/
- Hacking the Case Interview, Energy Case Interview Guide: https://www.hackingthecaseinterview.com/pages/industry-specific-case-interview
FAQ
Frequently asked questions
Keep reading
- Airline Case Interview: Profitability Framework, Revenue Drivers, and Worked Examples (2026)Frameworks · Mar 29, 2026
- Ansoff Matrix Case Interview: The 2x2 Growth Framework Explained with ExamplesFrameworks · Mar 25, 2026
- BCG Matrix Explained: Stars, Cash Cows, Question Marks, Dogs (2026)Frameworks · Mar 25, 2026
- ESG Case Interview: Dual-Metric Framework, Scope Emissions, and Worked Example (2026)Frameworks · Mar 31, 2026