Value Chain Framework for Case Interviews: Diagnose Margin Leaks Fast
Use Porter's value chain to isolate cost leaks and margin drivers in case interviews, with a fully worked manufacturing example.
On this page
The value chain framework breaks a business into sequential operational stages (from sourcing through after-sale service) to pinpoint exactly where margin is created or lost. Introduced by Michael Porter in Competitive Advantage (1985), it appears in roughly 20-30% of profitability cases at MBB, particularly when the problem is cost-side and operations-driven.
A BCG interviewer gave a candidate a straightforward prompt: "Our client, a specialty chemical manufacturer, saw margins drop 6 points in two years. Revenue is flat. Where would you start?" The candidate who scored highest mapped the client's value chain in 30 seconds, asked for per-stage cost data, and within three minutes identified that outbound logistics costs had spiked 40% because the company had shifted from bulk rail to LTL trucking after a distribution center closure. That specificity is what the value chain framework gives you that a standard profitability framework does not: it tells you where in the operation the problem lives.
What Is the Value Chain Framework?
The value chain framework breaks a business into sequential activities (from sourcing raw materials to after-sale service) to identify exactly where margin is created or lost at each stage. Introduced by Michael Porter in Competitive Advantage (1985), it is the sharpest tool for operations-heavy and cost-reduction case interviews. Use it after a profitability framework confirms that costs are the issue, to pinpoint which operational stage is driving the problem.
Porter's Full Value Chain Model
Porter's original model splits a firm's activities into two categories: primary activities that directly create and deliver the product, and support activities that enable the primary ones to function (Porter, 1985, Ch. 2). Most candidates only know the primary activities. Knowing the support activities gives you a second layer of diagnosis that most competitors in your interview pool will miss.
Primary Activities
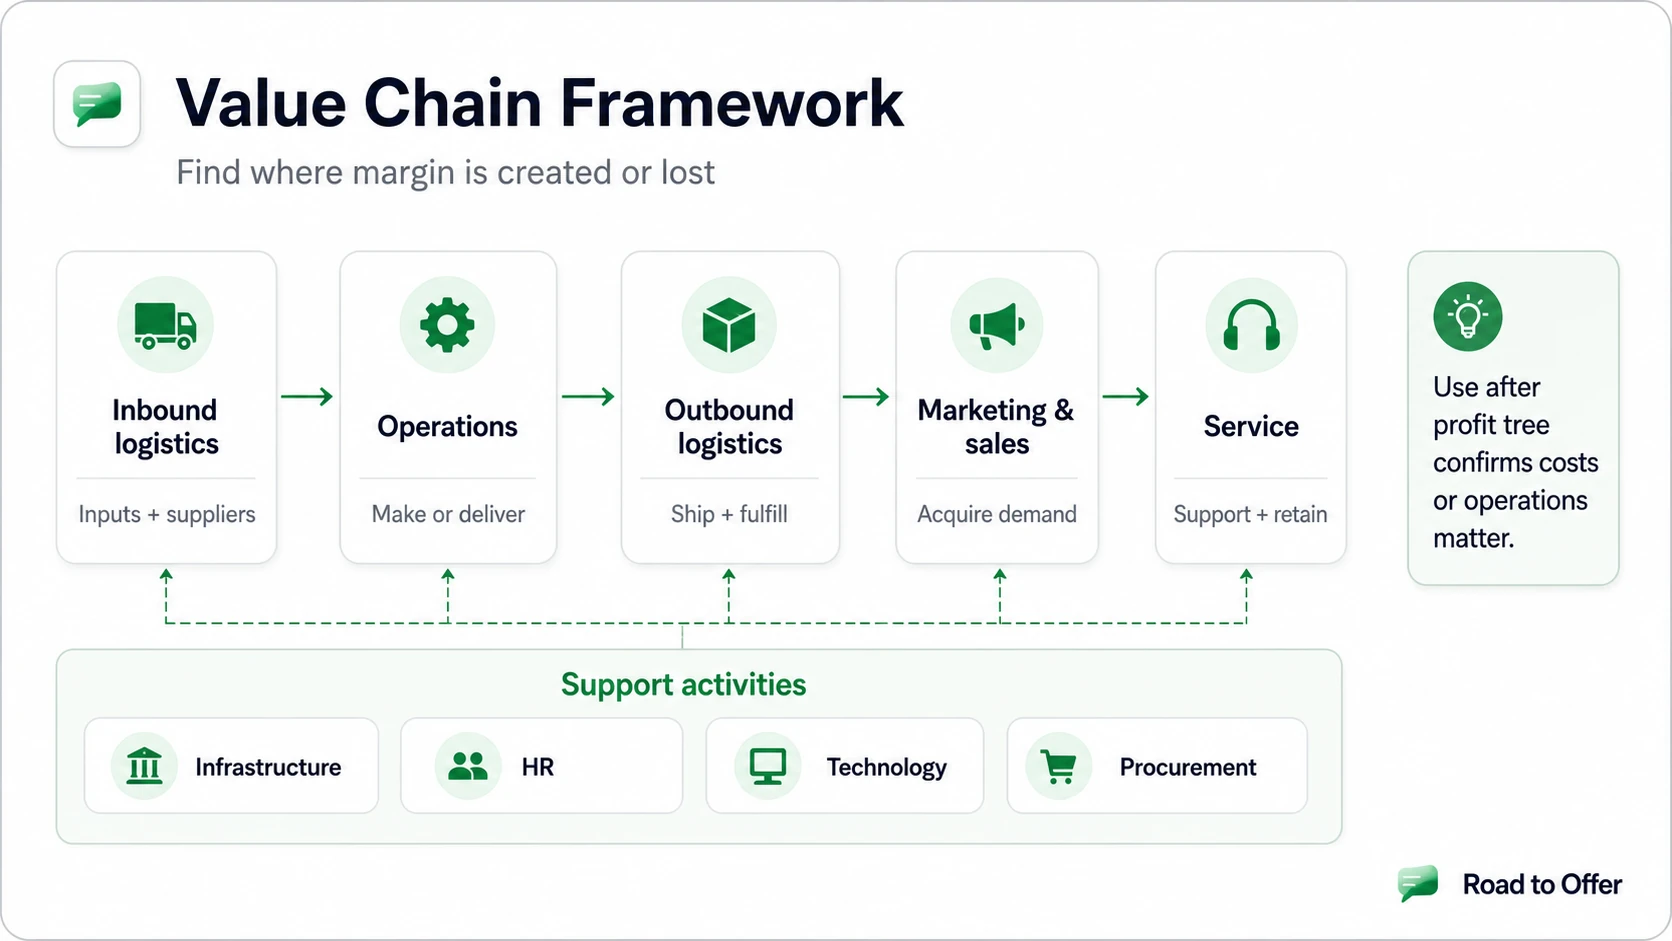
Each primary activity adds cost and, if done well, adds value that the customer will pay for. The interview question is always: which of these stages is underperforming relative to what it should cost or deliver?
Inbound Logistics covers procurement receipt, warehousing, and inventory management. Key metrics: supplier lead time, inbound freight cost per unit, and receiving error rate.
Operations is the transformation step: manufacturing, assembly, testing, packaging. Key metrics: yield rate, throughput time, cost per unit produced, and capacity utilization.
Outbound Logistics includes warehousing of finished goods, order fulfillment, and shipping to customers or retailers. Key metrics: cost per order shipped, on-time delivery rate, and shipping mode mix.
Marketing & Sales covers everything that drives demand and closes transactions: pricing, advertising, sales force, and channel management. Key metrics: customer acquisition cost, conversion rate, and marketing spend as a percentage of revenue.
Service is the post-sale activity: installation, repairs, returns processing, and customer support. Key metrics: cost-to-serve per customer, return rate, and customer satisfaction / NPS.
Support Activities
Support activities span across all primary activities. Porter identified four (Porter, 1985, Ch. 2):
- Firm Infrastructure: general management, planning, finance, accounting, legal, and government relations. This is the overhead that keeps the firm functioning.
- Human Resource Management: recruiting, training, compensation, and retention across all stages.
- Technology Development: R&D, process automation, IT systems, and product design.
- Procurement: the purchasing function itself, not the materials purchased, but the process and strategy of sourcing.
How to Use the Value Chain in Cases: A 5-Step Process
Most candidates know what a value chain is. Fewer know how to wield it under time pressure. Here is the sequence that works:
- Confirm the KPI. Clarify which metric is deteriorating: gross margin, operating margin, cycle time, service level, or cost per unit.
- Map the chain to the specific business. Do not recite a textbook. Adapt the stages to the client. A food manufacturer has different stages than a hospital system.
- Request per-stage cost or performance data. Ask the interviewer: "Do we have a cost breakdown by stage, or performance data for each step?" This is the move that separates structured candidates from generic ones.
- Benchmark each stage. Compare current performance to: (a) the client's own historical baseline, (b) industry averages, or (c) best-in-class competitors. The gap is your diagnosis.
- Prioritize 1-2 stages with the largest variance. Recommend targeted fixes with quantified impact for those stages specifically.
This process pairs naturally with the profitability framework. Use the profit tree to confirm whether the problem is revenue-side or cost-side. If it is cost-side, switch to the value chain to pinpoint the operational stage.
Worked Case: Margin Decline at a Consumer Packaged Goods Manufacturer
Prompt: Your client is a mid-size CPG company producing premium frozen meals. Operating margin declined from 14% to 6% over the past two years on roughly flat revenue of $400M. The CEO wants to understand where costs are leaking and what to do about it.

Profitability · easy
Run this exact margin-decline case end to end
CPG / Packaged Snacks
Step 1: Map the Value Chain and Request Data
You would say: "Since revenue is flat, this is a cost-driven margin decline. I would like to map the client's value chain and look at cost per stage as a percentage of revenue, compared to two years ago and to an industry benchmark."
The interviewer provides this data:
Step 2: Identify the Biggest Movers
The data tells a clear story. Three stages account for most of the 8 pp margin decline:
- Outbound Logistics: +4 pp (the single largest mover, and now 3 pp above industry benchmark)
- Operations: +2 pp (now at the high end of industry range)
- Service: +1 pp (above benchmark, worth investigating)
Step 3: Diagnose Root Causes
You dig into each stage:
Outbound Logistics (+4 pp, $16M cost increase): The company closed one of its three regional distribution centers 18 months ago to save on lease costs. The result: average shipping distance increased 35%, the company shifted from regional LTL consolidation to national parcel shipping for a large portion of orders, and expedited shipping requests from retailers doubled. The $2M saved on the DC lease created $16M in incremental shipping costs. This is a classic case of local optimization causing system-wide cost escalation.
Operations (+2 pp, $8M cost increase): An older production line was kept running past its useful life to avoid capital expenditure. Yield dropped from 94% to 88%, and unplanned downtime increased 40%. The deferred maintenance is now costing more than the replacement would have.
Service (+1 pp, $4M cost increase): Return rates on one product line increased from 2% to 5% due to packaging failures during longer shipping distances (linked to the outbound logistics problem).
Step 4: Quantify the Fix
Converting cost percentages into dollar impact and back into margin points is where most candidates lose accuracy under time pressure. Drill that conversion until it is automatic.
Step 5: Synthesize
"I recommend a three-part margin recovery program focused on outbound logistics, manufacturing operations, and service quality. The highest-impact lever is restoring regional distribution capacity, which caused a $16M cost spike when the DC was closed. Combined with production line replacement and packaging fixes, these actions can recover approximately $23M, or 5.8 percentage points of the 8-point decline. The remaining 2.2 pp gap will partially close through operating leverage as volume efficiency improves. Key risk: the DC reopening requires $4M in upfront capital and a 9-month timeline. I would recommend a phased approach, starting with carrier renegotiation and packaging fixes that deliver savings within the first quarter."
This kind of stage-specific, quantified diagnosis is what value chain analysis enables. For more on how to deliver recommendations with this level of structure, see case interview synthesis.
Value Chain for Service Industries
Porter acknowledged that his original model was built around manufacturing (Porter, 1985, Ch. 2). For service businesses, the primary activities need to be adapted. The logic is the same, but the stages change.
Service Value Chain: Adapted Stages
Framework
Service Industry Value Chain
- 01
Talent & Inputs
Recruiting, onboarding, and securing key resources
- 02
Service Design
Developing the service offering, methodology, or solution
- 03
Service Delivery
Executing the service for the client or customer
- 04
Client Acquisition
Marketing, sales, and relationship management
- 05
Post-Delivery
Follow-up, retention, upsell, and support
Example: Consulting Firm Cost Diagnosis
A consulting firm's margins have declined. Using the service value chain:
For a consulting firm, the highest-impact diagnosis is almost always in Service Delivery (utilization and staffing leverage) or Talent & Inputs (attrition and recruiting costs). If partner utilization drops from 65% to 55%, or associate attrition rises from 15% to 25%, the impact on margin is immediate and large.
This same adapted model works for hospitals (patient acquisition, diagnosis, treatment, discharge, follow-up), law firms (client intake, case preparation, litigation/advisory, billing, relationship management), and any service business where the "factory" is people and processes.
Value Chain vs. Profit Tree: When to Use Which
This is a question that comes up constantly. Here is the decision rule:
- Use a profitability framework (profit tree) to diagnose whether the problem is revenue or cost, and which sub-driver is moving.
- Use a value chain to diagnose where in the operational sequence costs are accumulating or value is being lost.
- In practice, use both in sequence. The profit tree tells you "variable costs increased 4 pp." The value chain tells you "that 4 pp increase is concentrated in outbound logistics because of the DC closure."
A strong candidate uses the profit tree for the first two minutes, then pivots to the value chain once they have confirmed it is an operations or cost problem. This pairing comes up in roughly 20-30% of profitability cases, particularly at McKinsey where operations cases are common.
You can also pair the value chain with the 3Cs framework when the case requires both internal operational diagnosis (value chain) and external market context (3Cs).
When NOT to Use the Value Chain
The value chain is not always the right tool. Here are the situations where it adds less value:
Pure digital and platform businesses. A two-sided marketplace like Uber or Airbnb does not have a linear sequence of inbound-operations-outbound. Its cost structure is driven by network effects, take rates, and platform economics. A unit economics model (CAC, LTV, contribution margin per transaction) is more useful. Porter himself acknowledged this limitation in his 2001 HBR article "Strategy and the Internet" (Porter, 2001).
Highly commoditized businesses with simple cost structures. If a business buys a commodity, processes it minimally, and sells it, there may not be enough differentiation across stages to make the value chain diagnostic useful. A simple cost-per-unit analysis works better.
Revenue-side problems. The value chain is fundamentally a cost and operations tool. If the problem is pricing, demand, or market share erosion, you are better off with a pricing strategy framework, customer segmentation, or the revenue side of a profit tree.
Early-stage startups. Startups often have not yet built out enough operational stages for a value chain to be meaningful. Their cost structure is dominated by a few items (salaries, cloud hosting, marketing) that do not map neatly to value chain stages.
Advanced: Margin Contribution by Stage
Porter argued that competitive advantage comes from performing value chain activities at lower cost or in a way that creates differentiation buyers will pay for (Porter, 1985, Ch. 3). In an interview, this means you should think about each stage in terms of its margin contribution, not just its cost.
A stage that costs 15% of revenue but enables 30% of the price premium (e.g., a proprietary manufacturing process that creates a superior product) is a source of competitive advantage. A stage that costs 15% of revenue and adds no differentiation is a candidate for cost reduction, outsourcing, or process redesign.
This framing is especially useful in M&A cases where you need to evaluate whether a target company's value chain has synergies with the acquirer's. If both companies have expensive outbound logistics operations serving overlapping geographies, that is a concrete synergy. If their value chains do not overlap in any meaningful way, the "synergy" thesis is weaker.
Interactive Drills: Value Chain Diagnosis
Common Mistakes in Value Chain Analysis
- Listing stages without diagnosing. Naming the five primary activities is not analysis. You need to identify which stage has the largest cost variance and why.
- Ignoring linkages between stages. Porter emphasized that the most important insights come from linkages, the way one activity affects the cost or performance of another (Porter, 1985, Ch. 2). The DC closure example above is a linkage problem.
- Using the manufacturing model for every industry. If the case is about a consulting firm, law firm, or hospital, adapt the stages. Do not force "inbound logistics" onto a people-based business.
- Skipping the benchmark. Saying "outbound logistics costs are 14% of revenue" means nothing without context. Is the industry average 10% or 15%? Always compare to a baseline.
- Stopping at diagnosis. The value chain identifies the problem. You still need to recommend specific, quantified fixes and present a clear synthesis.
How to Practice Value Chain Cases
Value chain cases are a subset of operations and profitability cases. To build fluency:
- Practice identifying the right framework. Not every cost problem needs a value chain. Use case interview examples to practice recognizing when to deploy it.
- Build industry-specific value chains. Before your interview, map the value chain for 3-4 industries: manufacturing, retail, healthcare, and professional services. This takes 10 minutes per industry and pays off immediately.
- Drill the profit tree to value chain handoff. Practice going from "costs increased" to "which stage?" in under 60 seconds. This transition is where most candidates stall.
- Study real cost structures. Annual reports and 10-K filings break out cost of goods sold, SG&A, and sometimes logistics costs. Reading two or three of these for the industry your target firm serves gives you realistic benchmarks.
For structured practice with AI feedback on your diagnosis quality, how to practice case interviews covers the full approach.
Related Framework Guides
Build a complete toolkit. Value chain analysis rarely shows up in isolation:
- Case Interview Frameworks Complete Guide, the master framework selector covering when value chain fits versus profitability, M&A, or operations
- Profitability framework, the natural companion for cost-side diagnosis
- M&A case framework, where value chain overlay identifies synergies
- Operations Cost Framework, the deeper dive on process-level cost levers within the value chain
- Porter's Five Forces, another Porter framework for industry-level analysis
- Pricing strategy cases, for when the issue is revenue-side, not operations
- Case interview synthesis, how to deliver your value chain findings as a clear recommendation
- Case interview examples, full worked cases across all major types
Sources and Further Reading (checked June 17, 2026)
- Porter, M.E. (1985). Competitive Advantage: Creating and Sustaining Superior Performance. New York: Free Press. Chapters 2-3 cover the value chain model, activity analysis, and linkages.
- Porter, M.E. (2001). "Strategy and the Internet." Harvard Business Review, 79(3), 62-78. Discusses limitations of value chain in digital contexts.
- Porter, M.E. (1985). "How Information Gives You Competitive Advantage." Harvard Business Review: hbr.org/1985/07/how-information-gives-you-competitive-advantage
- CFI, value chain analysis overview: corporatefinanceinstitute.com/resources/management/value-chain/
- McKinsey operations insights hub: mckinsey.com/capabilities/operations/our-insights
- Management Consulted, operations case frameworks: managementconsulted.com/operations-case-interview/
- Investopedia, value chain definition and examples: investopedia.com/terms/v/valuechain.asp
FAQ
Frequently asked questions
Keep reading
- Start free consulting drillsPractice
- Cost Reduction Case Interview: Framework, Worked Examples, and Common Traps (2026)Frameworks · Mar 20, 2026
- Operations & Cost Optimization Framework for Case Interviews (2026)Frameworks · Feb 19, 2026
- Profitability Framework: Formula, Steps & ExamplesFrameworks · Feb 3, 2026