
Revenue Growth Case Interview: Framework, Levers, and Worked Examples (2026)
Master revenue growth cases with a structured framework covering organic and inorganic levers, pricing vs volume, and fully worked examples.
On this page
A revenue growth case interview in 2026 asks how a company should increase top-line revenue, and the right first move is the same every time: decompose Revenue = Price x Volume, then split the problem by product, customer, channel, and geography before you choose growth levers. A generic answer like "increase sales" gives the interviewer nothing to test; a segmented one like "increase online channel revenue in the Northeast by 15% through paid acquisition" is a hypothesis you can actually prove or kill with data. Once the tree is segmented, the two lenses that matter are organic growth (pricing, volume, new products, new channels, new geographies) and inorganic growth (acquisitions, partnerships), and the trade-off between them is speed versus integration risk. Price moves look attractive on paper but rarely land at full value, a 10% price increase paired with a 12% volume drop nets out to a 3.2% revenue decline, so elasticity has to be modeled explicitly rather than assumed away. This guide walks through the revenue tree, the price-volume trade-off, organic and inorganic levers, and a fully worked B2B SaaS growth example.
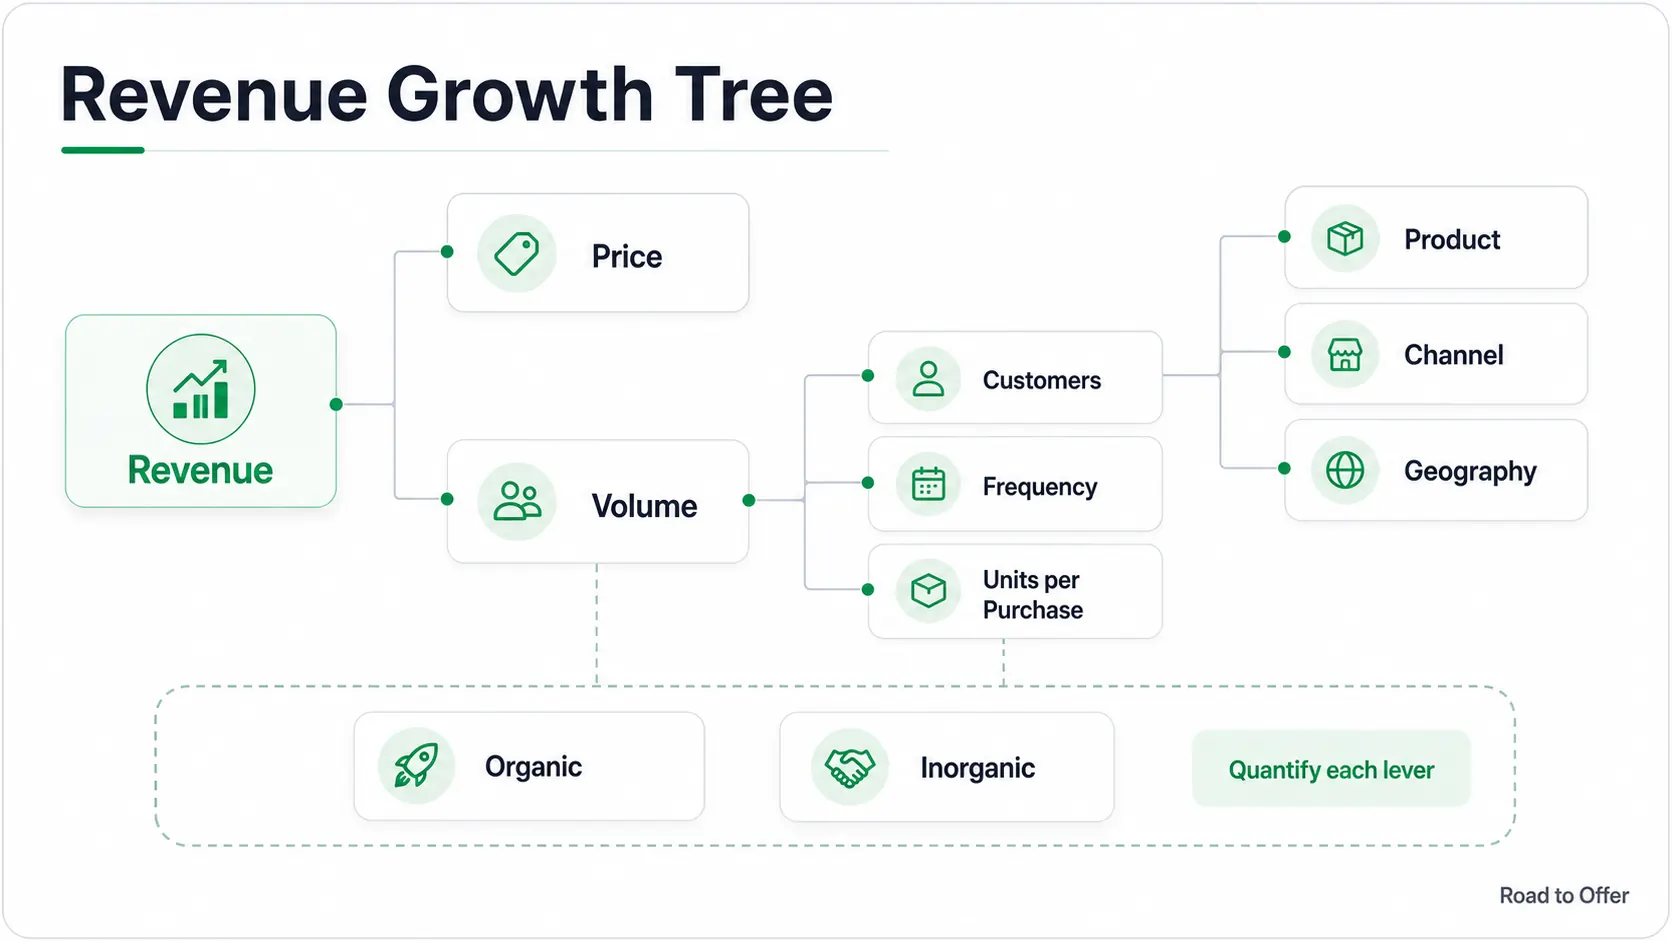
The Revenue Tree
Every revenue growth case starts with this decomposition. Segment revenue before proposing solutions. "Increase sales" is too vague; "increase online channel revenue in the Northeast by 15% through paid acquisition" is actionable (PrepLounge).
Practice a revenue growth drill
Try the lever-generation rep before reading the SaaS answer: bucket the growth ideas, pick the highest-impact test, and explain the next data request.
revenue growth from the Road to Offer drill engine. Answer a real prompt and get AI-scored feedback. Free accounts include 5 drills per day for the first 3 days after signup.
Before proposing a growth move, diagnose this static prompt: revenue rose 4%, list price rose 8%, total units fell 6%, and the online channel gained mix. The first answer is not "grow online." Reconcile price, volume, and mix, ask for channel-level revenue, and isolate whether online mix softened or amplified the decline in units.
Organic Growth: Price Levers
Price-based growth can add revenue with less operational capacity than volume growth, but it can also reduce demand. Treat the five levers below as options to test, not a universal impact ranking:
- Value-based pricing: Shift from cost-plus to willingness-to-pay. If customers derive $100K in value, charging $30K vs. $20K is justifiable.
- Reduce discounting: Tighten discount authority and calculate the recoverable revenue from the case's discount data.
- Tiered pricing / upsell: Create tiers and estimate migration from the case's customer evidence.
- Across-the-board increase: Test a list-price change against elasticity, competitor response, and customer concentration.
- Mix management: Promote higher-margin products. Shifting a 50/50 mix (60% vs. 35% margin products) to 60/40 raises blended margin 5 points.
Organic Growth: Volume Levers
Volume growth requires more investment but carries less churn risk than price increases.
- New customers in existing markets: Expand marketing, sales team, or improve conversion. Track CAC to ensure profitability.
- Increase wallet share: Cross-sell, upsell, or increase frequency, then compare the incremental acquisition and service cost with a new-customer route.
- New geographies: Expand domestically or internationally. See the Market Entry Framework.
- New products: Adjacent products (existing customers, new offerings) are lower risk than entirely new categories.
- New channels: Add e-commerce, wholesale, or marketplace partnerships. Each has a different margin profile.
The Price-Volume Trade-Off
A 10% price increase rarely causes zero volume loss. Model the trade-off explicitly:
Formula: Net Impact = (1 + Price Change%) x (1 + Volume Change%) - 1. Use the case's elasticity or bracket a range rather than importing one industry-wide assumption.
Inorganic Growth: When Organic Is Not Enough
When the growth target exceeds what organic levers can deliver, or the market is consolidating, acquisitions become necessary (Hacking the Case Interview).
For the full growth-case structure beyond the revenue tree, sequencing organic first, phasing the plan, and writing the recommendation, see growth strategy cases.
Choose the right lever in a BCG growth strategy case. A premium fitness brand must reach a $70M EBITDA target by 2027. Answer this BCG growth strategy case step in the article, then continue the full case. Continue the full case on Road to Offer
Worked Example: B2B SaaS Growth
Prompt: A B2B SaaS company (5,000 customers, $100M ARR, 8% YoY growth) needs 20% growth ($20M incremental). How?
Revenue segments:
Lever 1: Enterprise upsell (price). Launch enterprise-plus tier at $220K. Convert 40% (80 accounts). Incremental: 80 x $70K = $5.6M.
Lever 2: Mid-market acquisition (volume). Add 6 sales reps under the illustrative assumption of 50 deals per rep per year. 300 new accounts x $25K = $7.5M. The $7.5M first-year revenue divided by $900K investment is 8.3x gross revenue to investment, not ROI; margin and operating costs are not included.
Lever 3: Integrations marketplace (new product). Charge partners 15% commission. Benchmark: 5-10% of core ARR within 2 years. Target: $7M.
Lever 4: Churn reduction (retained revenue). Reduce annual churn from 12% to 9% with $1.5M customer success investment. Saves $3M, net $1.5M. Over 5 years, 3-point churn improvement retains $15M cumulatively. Bain & Company research shows increasing retention by 5% can boost profits 25-95%.
Total: $5.6M + $7.5M + $7M + $1.5M = $21.6M (meets $20M target).
Run the same lever math yourself on a different set of levers, because the total is what decides whether a plan clears its target.
Quick Math
- Price rises 12% and volume falls 5%. What is the net revenue impact, in percent?
Net impact = (1 + price change) x (1 + volume change) - 1. Multiply the two effects; netting the percentages gives the wrong answer.
- An enterprise-plus tier lifts 120 converted accounts by $45K each. What incremental ARR does the upsell lever deliver? Answer in $M.
Incremental ARR = Converted accounts x Uplift per account. Price levers land fastest because the relationship already exists.
- Four levers deliver $5.4M of upsell, $6.2M of new mid-market logos, $4.9M of marketplace revenue and $2.5M of net churn savings. What is the total incremental ARR?
Total incremental ARR = the sum of every lever, so you can say where it lands against the target and which one you would push harder.
Common Mistakes
Related Guides
- Profitability Framework: revenue growth is the top-line half of profitability
- Revenue Decline Case Interview: the diagnostic mirror: before building a growth plan, understand why the current revenue fell
- New Product Launch Case Interview: product line extension as a volume growth lever; launch cases are often nested inside revenue growth cases
- Pricing Strategy Cases: price-based growth in depth
- Customer Profitability Case Interview: segment-level revenue analysis to identify which customer cohorts to grow and which to deprioritize
- M&A Case Framework: inorganic growth through acquisitions
Turn the Revenue Tree into a growth decision
Use the guided BeanCraft case to choose the biggest lever, test the trade-off, and recommend the next move.
Run another growth brainstorm.
Sources
- My Consulting Offer: Revenue Growth Case Interview (accessed March 20, 2026)
- Hacking the Case Interview: Growth Strategy Case Interview (accessed March 20, 2026)
- CaseCoach: Framework for Revenue Growth Case Questions (accessed March 20, 2026)
- PrepLounge: Growth Strategy Case Interview (accessed March 20, 2026)
- Simon-Kucher: Unlocking Potential with Revenue Growth Management (accessed March 20, 2026)
- Management Consulted: Growth Strategy Case Interview (accessed March 20, 2026)
Frequently asked questions
Resources and related guides
- Practice structure drillsPractice
- Browse all free resourcesResource hub
- Growth Strategy Framework: How to Structure Growth CasesFrameworks · Feb 3, 2026
- Pricing Case Interview: Strategies, 7-Step Approach, Worked ExampleFrameworks · Feb 3, 2026
- Scale vs Profitability Case Interview: Decision FrameworksFrameworks · Jun 2, 2026