Consulting Math Formulas: The Case Interview Reference (With Worked Examples)
Every consulting math formula for case interviews: margins, CAGR, break-even, ROI, NPV, market share, and unit economics. Each one with a worked example, when to use it, and the mistake that costs offers.
On this page
This is a working reference for the small set of formulas that repeat across consulting case interviews: margins, growth rates, break-even, ROI, payback, NPV, market share, and unit economics. Each one below comes with the formula, a fully worked numeric example, a short note on when interviewers reach for it, and the specific mistake that loses points. In the interview the formula only helps if you can choose it fast, attach the right units, do the arithmetic cleanly, and say what it means for the business. For a shorter pre-interview list, use the case interview formulas cheat sheet.
Start free math drills
Practice applying these formulas with feedback on setup, units, and final business implication.
How Do You Pick the Right Formula?
Most candidates know the formulas and still freeze, because the prompt rarely says "calculate CAGR." It says "the market grew from 4 billion to 9 billion over six years." Translate the words into a formula family first.
State the formula aloud before you compute. "To check whether the launch breaks even, I need fixed costs over contribution margin per unit" tells the interviewer you chose the right tool, which is half the score even before the arithmetic.
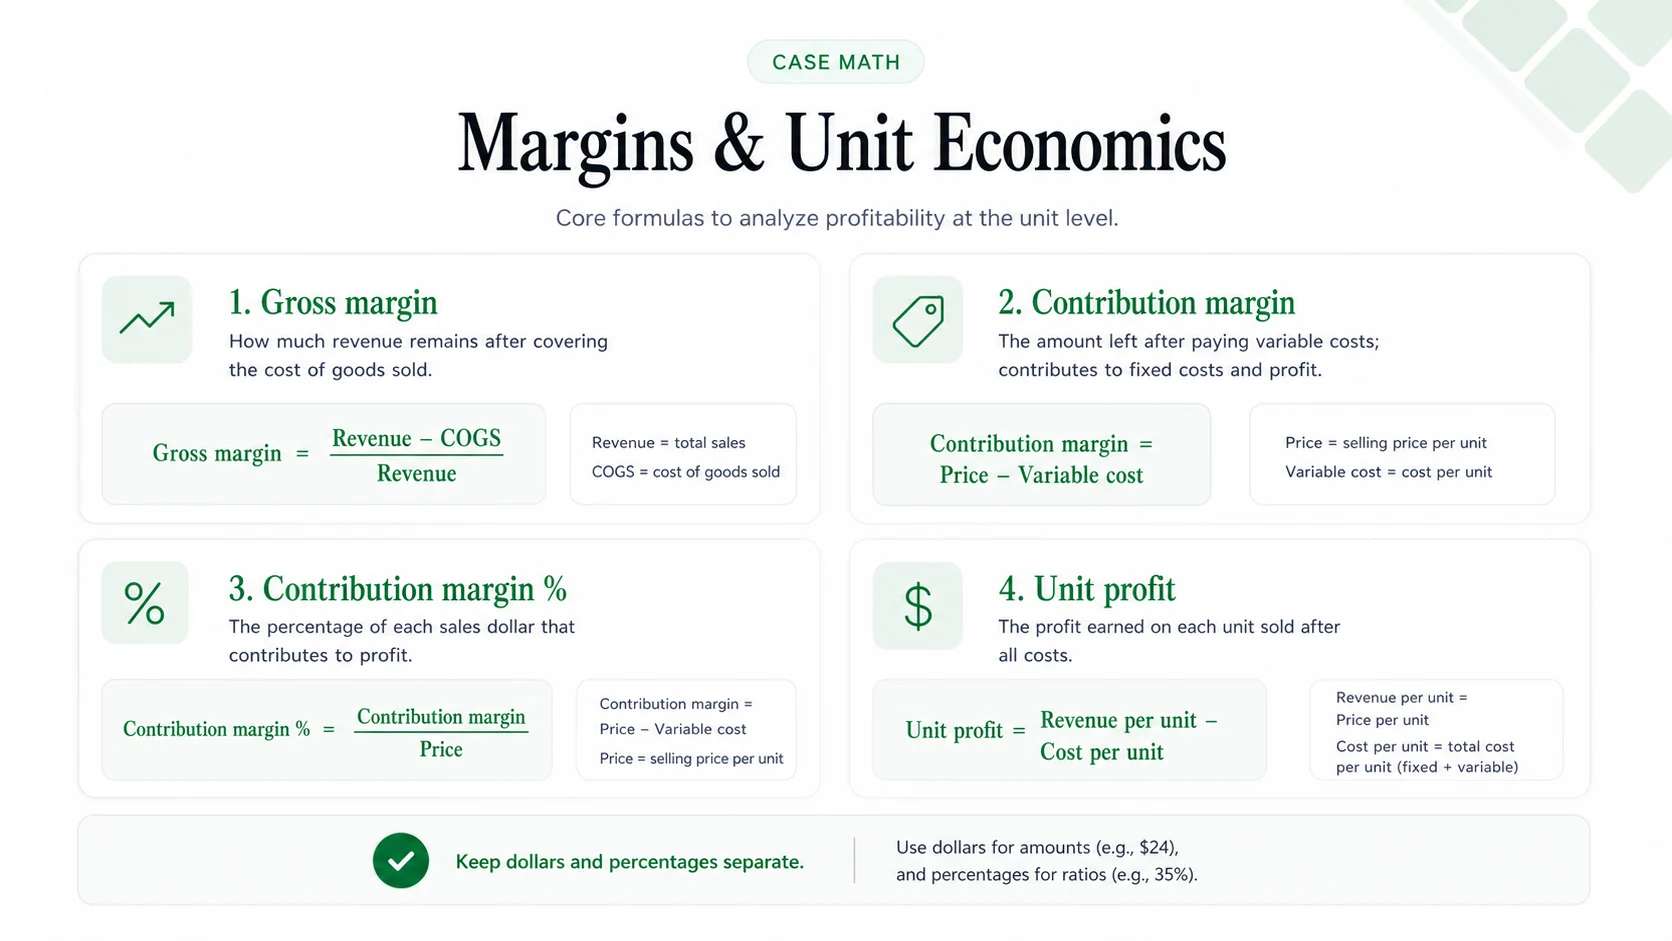
Margin Formulas: Gross, Operating, and Contribution
Gross margin = (Revenue − COGS) / Revenue
Operating margin = EBIT / Revenue
Contribution margin per unit = Price − Variable Cost per unit
Contribution margin % = (Price − Variable Cost) / Price
Worked example: a product sells for $50 with $30 of COGS. Gross profit is $20, but gross margin is $20 / $50 = 40%. The contribution margin per unit, if the only variable cost is the $30, is also $20, which feeds straight into break-even.
Gross margin measures what is left after direct production costs. Operating margin captures the full P&L including SG&A and depreciation. Contribution margin isolates what each incremental unit contributes toward covering fixed costs, so it is the bridge between margin questions and break-even questions.
According to the Corporate Finance Institute, confusing gross margin percentage with gross profit dollars is the most common candidate error. When an interviewer asks for the margin, they want 40%, not the $20 figure. Industry benchmarks let you sanity-check on the spot: software and SaaS run 70 to 80%, consumer goods 40 to 60%, retail 25 to 40%, and manufacturing 20 to 35%.
Common mistake: dividing by COGS instead of revenue, or quoting profit dollars when asked for a percentage. For the diagnosis that usually precedes the math, see the profitability framework.
Interactive drill set. Write an answer before revealing the worked solution, then continue into Road to Offer for scored practice and AI feedback.
Blended Margin: The Weighted Average Trap
When a company sells two products at different margins, the company-level margin is a weighted average, not a simple average. This shows up constantly in profitability cases and trips people up.
Worked example: a retailer sells $60M of high-margin services at 70% gross margin and $40M of low-margin hardware at 20%. The blended margin is not (70% + 20%) / 2 = 45%. It is revenue-weighted: (0.70 × $60M + 0.20 × $40M) / $100M = ($42M + $8M) / $100M = 50%. If the mix shifts toward hardware next year, the blended margin falls even though neither product's margin changed, and naming that mix effect is exactly the insight a profitability case rewards.
Common mistake: averaging the percentages instead of weighting by revenue or volume.
Interactive drill set. Write an answer before revealing the worked solution, then continue into Road to Offer for scored practice and AI feedback.
Growth Rate Formulas: Percentage Change, YoY, and CAGR
Percentage change = (New − Old) / Old
Year-over-year growth = (Current Year − Prior Year) / Prior Year
CAGR = (End Value / Start Value)^(1/n) − 1
Worked example: revenue grows from $100M to $112M in one year, so YoY growth is $12M / $100M = 12%. Over a longer horizon, suppose a market doubled from $4B to $8B in 6 years. Rather than computing the sixth root, use the Rule of 72: years to double = 72 / rate, so rate ≈ 72 / 6 = 12% CAGR.
When an interviewer says "grew from X to Y over N years," they want compound annual growth, not the simple average. The Rule of 72 turns the exponent into mental math: doubling in 6 years is about 12%, doubling in 4 years is about 18%, doubling in 9 years is about 8%.
Per Wall Street Prep, the most common CAGR application in interviews is comparing company growth to market growth. A company growing at 8% CAGR inside a 12% CAGR market is losing share, which becomes a diagnostic signal for the rest of the case. Look for doubling, tripling, or clean fractions before reaching for precise approximation. For more reps on rounding and percentages, use mental math for case interviews.
Common mistake: reporting simple average growth over a multi-year period, which overstates compounding, or losing a power of ten when the start and end values carry different numbers of zeros.
Interactive drill set. Write an answer before revealing the worked solution, then continue into Road to Offer for scored practice and AI feedback.
Break-Even Analysis: Units and Revenue
Break-even units = Fixed Costs / Contribution Margin per Unit
Break-even revenue = Fixed Costs / Contribution Margin %
Worked example: fixed costs are $3.6M, price is $120, and variable cost is $30. Contribution margin per unit is $120 − $30 = $90, so break-even = $3,600,000 / $90 = 40,000 units.
Break-even is the most commonly tested calculation in profitability, pricing, and new-product cases. It answers "at what volume does this stop losing money?" and appears in launches, new-store decisions, and price changes.
The Corporate Finance Institute flags margin of safety as a useful extension: how far above break-even is actual volume? A company selling 100,000 units against a 40,000 break-even has a 60,000-unit cushion, a 60% margin of safety.
Worked price-change scenario: the same subscription product at $120/year breaks even at 40,000 subscribers. Drop the price to $100 and the contribution margin falls to $100 − $30 = $70, so break-even rises to $3,600,000 / $70 = 51,429 subscribers, a 29% jump in the volume you need just to stand still. That is the kind of second-order point a pricing case is built to surface.
Common mistake: dividing fixed costs by price instead of by contribution margin, which understates break-even and flips the recommendation. See where this lands most often in pricing strategy cases.
Interactive drill set. Write an answer before revealing the worked solution, then continue into Road to Offer for scored practice and AI feedback.
Market Share and Market Size
Market share = Company Revenue / Total Market Revenue
Market size = Number of Target Customers × Average Annual Spend
Worked example: a company books $15M of revenue in a market worth $150M, so its share is $15M / $150M = 10%. If the market is growing at 4% and the company wants to hold share, it needs to grow revenue at least 4% just to stay flat.
Market share connects the growth and sizing math to the competitive story. A falling share inside a growing market is the classic "we are growing but losing the race" finding. Pair this with market sizing step-by-step for the estimation side, where these two formulas dominate.
Common mistake: comparing revenue share to unit share without saying which one, since a premium player can hold a small unit share but a large revenue share.
Interactive drill set. Write an answer before revealing the worked solution, then continue into Road to Offer for scored practice and AI feedback.
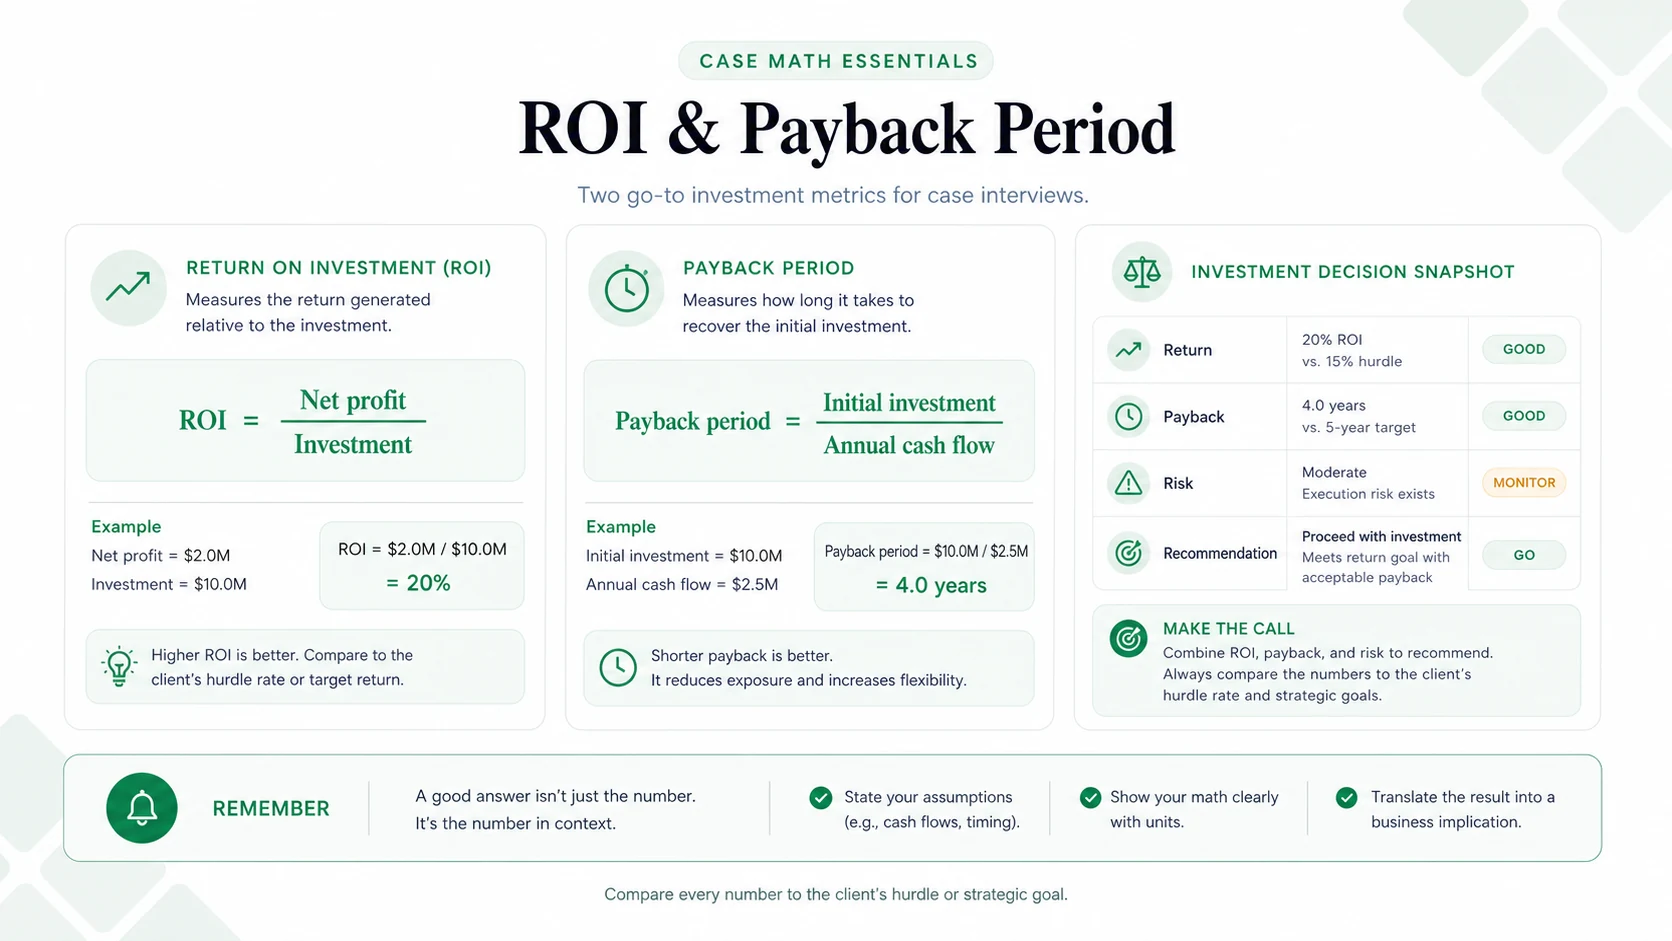
ROI and Payback Period
ROI = (Gain − Cost) / Cost
Payback Period = Investment Cost / Annual Net Cash Inflow
Worked example: a $2M automation system saves $800K per year. ROI is ($800K − implied annualized cost) but in the simple single-year framing, the first-year return is $800K / $2M = 40%, and payback is $2M / $800K = 2.5 years. Now net out $100K of annual maintenance: net savings fall to $700K, so payback becomes $2M / $700K ≈ 2.9 years.
ROI gives return as a percentage; payback tells you how fast the cash comes back. Both appear in capital-allocation and "should we spend $X on Y" prompts. Per the Corporate Finance Institute, the most common error is forgetting to net out the ongoing operating cost of the new system.
In context, benchmark ROI against the company's cost of capital, often 10 to 15%. A 40% return with a 2.9-year payback is attractive relative to most alternative uses of that cash.
Common mistake: ignoring annual operating or maintenance costs, which makes the investment look better than it is.
Interactive drill set. Write an answer before revealing the worked solution, then continue into Road to Offer for scored practice and AI feedback.
NPV: Net Present Value
NPV = Sum of [Cash Flow / (1 + r)^t] − Initial Investment
Perpetuity value = Annual Cash Flow / Discount Rate
Growing perpetuity value = Annual Cash Flow / (Discount Rate − Growth Rate)
Worked example: a project generates $4M per year growing at 2%, with a 12% discount rate. Value the stream first: $4M / (12% − 2%) = $4M / 10% = $40M. Then subtract the $20M upfront investment, so net NPV = $40M − $20M = $20M positive.
NPV is the most conceptually demanding item because candidates value the future cash flows correctly and then forget the upfront investment. Per PrepLounge, interviewers use NPV to see whether you can judge if a project's present value exceeds its upfront cost, not to test exponent arithmetic. In most cases the perpetuity shortcut is enough.
Interactive drill set. Write an answer before revealing the worked solution, then continue into Road to Offer for scored practice and AI feedback.
Unit Economics: CAC, LTV, and Payback
CAC = Total Sales & Marketing Spend / New Customers Acquired
LTV = (Monthly Revenue × Gross Margin %) / Monthly Churn Rate
CAC Payback Period = CAC / (Monthly Revenue × Gross Margin %)
Worked example: $8M of sales and marketing produces 2,000 customers, so CAC = $8,000,000 / 2,000 = $4,000. If monthly gross profit per customer is $2,250, CAC payback = $4,000 / $2,250 ≈ 1.8 months.
Unit economics dominate tech, subscription, and marketplace cases. The LTV:CAC ratio is the headline: below 1:1 destroys value, around 3:1 is healthy, and above 5:1 can signal under-investment in growth. For CAC payback in B2B SaaS, under 18 months is healthy and over 24 months flags a capital-efficiency problem.
Worked ratio: a SaaS company with $150 monthly ARPU, 70% gross margin, and 2% monthly churn has monthly gross profit of $150 × 70% = $105, so LTV = $105 / 2% = $5,250. Against a $2,000 CAC that is a 2.6:1 ratio, below the 3:1 benchmark, which points to improving retention or cutting acquisition cost. The deeper treatment lives in the unit economics framework and the customer lifetime value framework.
Common mistake: using revenue instead of gross profit in LTV, which inflates lifetime value and hides a broken model.
Interactive drill set. Write an answer before revealing the worked solution, then continue into Road to Offer for scored practice and AI feedback.
Mental Math Shortcuts That Make the Arithmetic Possible
The formulas are useless if the arithmetic stalls. A few habits keep you fast and accurate without a calculator.
- Strip trailing zeros, then add them back. 4,000 × 250 becomes 4 × 25 = 100, then reattach five zeros for 1,000,000. Track the zeros on paper so you do not drop a power of ten.
- Factor with 5s and 2s. Anything × 5 is anything × 10 / 2. So 86 × 5 = 860 / 2 = 430.
- Use fraction equivalents for percentages. 1/4 = 25%, 1/8 = 12.5%, 1/3 ≈ 33%, 1/6 ≈ 17%. To take 12.5% of 320, divide by 8: 40.
- Round to anchor, then correct. 96 × 1,300,000 ≈ 100 × 1,300,000 = 130,000,000, then subtract 4 × 1,300,000 = 5,200,000 for 124,800,000.
- Keep units explicit. Write "$/unit," "$/month," "units/year." Most large-number errors are unit or zero errors, not formula errors.
These reps are exactly what timed practice builds. Drill them with mental math shortcuts for case interviews and case interview math practice.
Interactive drill set. Write an answer before revealing the worked solution, then continue into Road to Offer for scored practice and AI feedback.
How to Present the Math So It Scores
Interviewers grade communication as heavily as the answer. A clean process turns a correct number into a strong signal.
- Lay out the approach before computing. Name the formula and the inputs you need, and confirm with the interviewer.
- Narrate as you go. Silent calculation gives the interviewer nothing to follow or correct, and a clean self-correction often scores higher than mechanical perfection.
- Lead with the headline, then interpret. "Break-even is 40,000 units, which is 12% of the addressable market, so this looks reachable in year one." The number plus the "so what" is the point.
- Sanity-check against benchmarks. If a retail gross margin comes out at 75%, say it looks high and re-examine the inputs.
Directionally correct, delivered fast, with sharp interpretation beats four-decimal precision delivered in silence. For the full pattern, see case interview math tips.
Worked Example: Chaining Multiple Formulas
A B2B software company has $80M revenue, 75% gross margin, 2,000 new customers last year on $8M of sales and marketing spend, $3,000 monthly ARPU, and 1.5% monthly churn. It is weighing a $15M investment expected to generate $5M of annual profit growing at 5%, against a 15% hurdle rate.
Step 1, unit economics. CAC = $8,000,000 / 2,000 = $4,000. Monthly gross profit per customer = $3,000 × 75% = $2,250. LTV = $2,250 / 1.5% = $150,000. LTV:CAC = $150,000 / $4,000 = 37.5:1, exceptional. CAC payback = $4,000 / $2,250 ≈ 1.8 months.
Step 2, investment NPV. Value the growing stream: $5M / (15% − 5%) = $5M / 10% = $50M. Net NPV = $50M − $15M = $35M positive.
Step 3, synthesis. "Strong unit economics with a 37.5:1 LTV:CAC give plenty of headroom for growth investment. The $15M expansion generates $35M of net NPV against a 15% hurdle, so it clears the bar comfortably. The key risk is enterprise churn: if it doubles from 1.5% to 3%, LTV halves to $75,000 and the economics tighten, so I would want to validate the churn assumption before committing."
Interactive drill set. Write an answer before revealing the worked solution, then continue into Road to Offer for scored practice and AI feedback.
Practice core consulting formulas from the Road to Offer drill engine: a real prompt, your answer, and AI-scored feedback. Free account includes free daily drills.
Related Guides
- Case Interview Math Practice: timed drills using these exact formulas
- Mental Math Shortcuts for Case Interviews: rounding, anchoring, and approximation techniques
- Mental Math for Case Interviews: speed targets and worked percentage, break-even, and price-volume math
- Case Interview Math Tips: how to present and communicate the numbers
- Profitability Framework: how to structure a profitability diagnosis before reaching for formulas
- Market Sizing Step-by-Step: where growth rate and market share formulas dominate
- Guesstimate Interview Questions: estimation prompts where setup and sanity checks matter more than precision
- Pricing Strategy Cases: where break-even formulas appear most often
- Unit Economics Framework: the deeper treatment of CAC, LTV, and payback
- Case Interview Prep Guide: complete preparation roadmap
Sources and Further Reading (checked June 18, 2026)
- Corporate Finance Institute, Break-Even Analysis: https://corporatefinanceinstitute.com/resources/accounting/break-even-analysis/
- Corporate Finance Institute, ROI Formula: https://corporatefinanceinstitute.com/resources/accounting/return-on-investment-roi-formula/
- Wall Street Prep, CAGR (Compound Annual Growth Rate): https://www.wallstreetprep.com/knowledge/cagr-compound-annual-growth-rate/
- PrepLounge, Net Present Value (NPV) in case interviews: https://www.preplounge.com/en/case-interview-basics/net-present-value-npv
- IGotAnOffer, Case interview maths guide: https://igotanoffer.com/blogs/mckinsey-case-interview-blog/case-interview-maths
- Management Consulted, Case Interview Formulas: https://managementconsulted.com/case-interview-formulas/
- Hacking the Case Interview, 26 essential case interview formulas: https://www.hackingthecaseinterview.com/pages/case-interview-formulas
Frequently asked questions
Resources and related guides
- Use the math in a real casePractice
- Browse all free resourcesResource hub
- Best Free AI for Case Interview Math Practice (2026)Math And Quant · May 8, 2026
- Break-Even Analysis for Case Interviews: Formula, Worked Examples, and When to Use It (2026)Math And Quant · Mar 20, 2026
- Mental Math for Case Interviews: Speed Drills, Tricks, and MistakesMath And Quant · Feb 1, 2026