ROI, NPV & Payback Period for Case Interviews (2026)
When to use ROI, NPV, and payback period in case interviews, with formulas, worked examples, and how interviewers score the math.
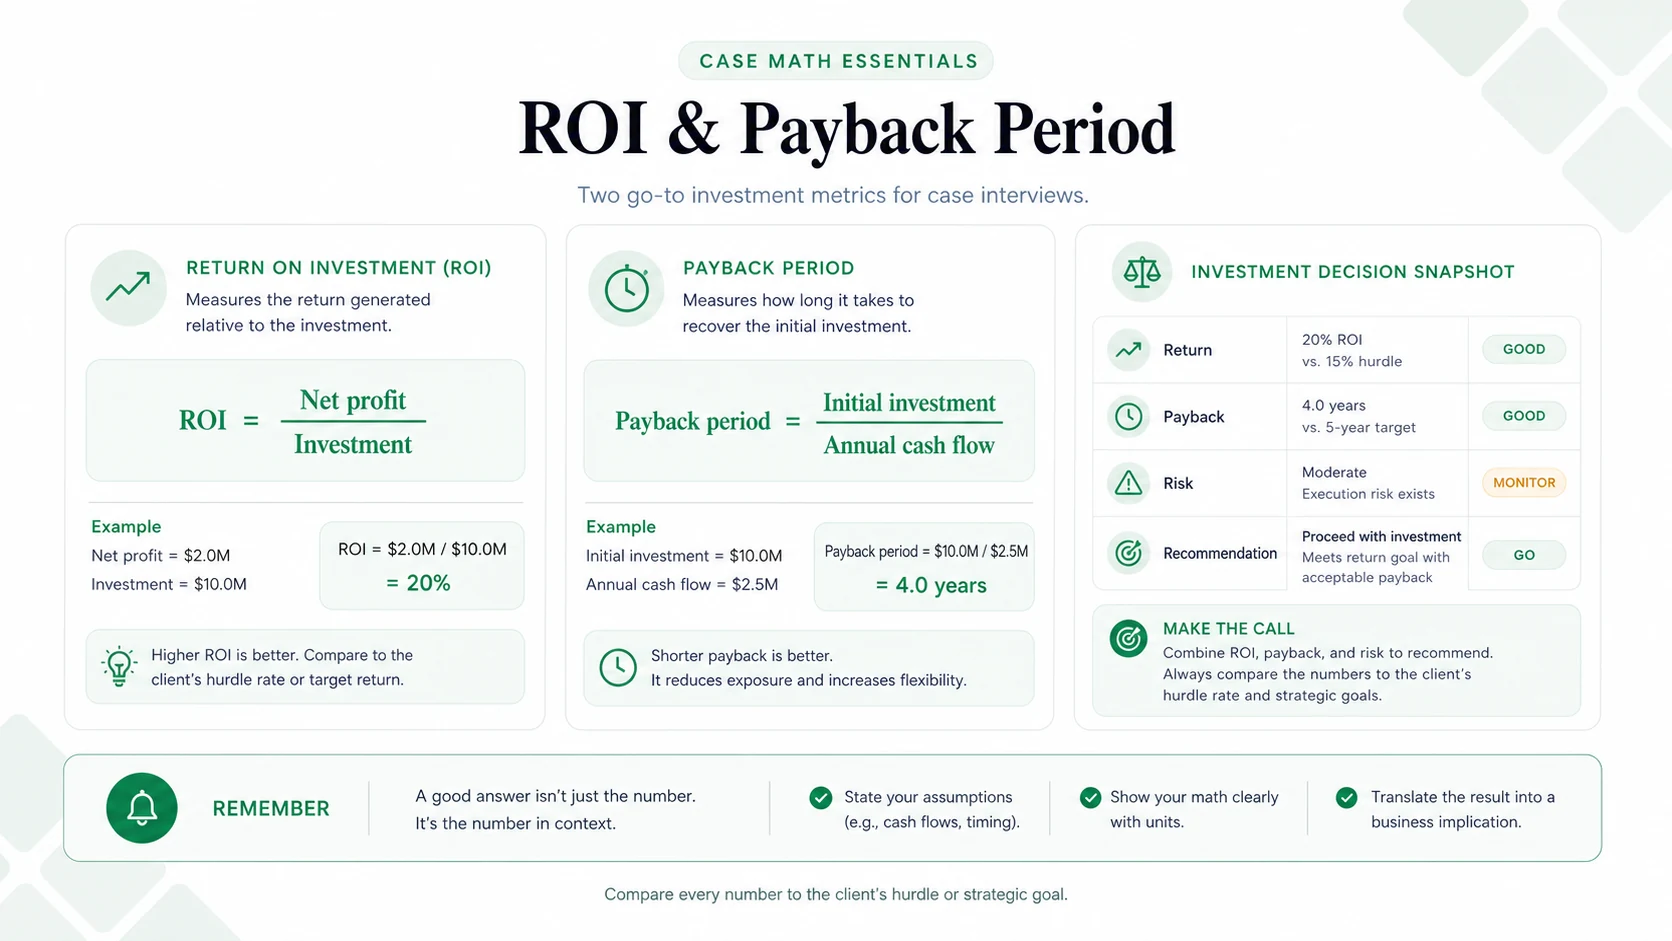
ROI measures percentage return (Net Profit / Investment Cost x 100), NPV discounts future cash flows to today's dollars, and payback period calculates years to recover the investment. Use ROI for quick same-timeline comparisons, NPV when cash flows span 5+ years or vary by period, and payback when the client prioritizes speed of capital recovery. If the interviewer mentions a discount rate, that signals NPV.
The Four Formulas: When to Use Each
ROI is the fastest to calculate and works for comparing investments with similar time horizons. Its limitation: ignoring the time value of money makes 50% ROI over 2 years look identical to 50% over 10 years.
NPV is the most theoretically correct metric, accounting for when cash flows arrive. Use the perpetuity shortcut (Annual Cash Flow / Discount Rate) for constant streams or the annuity factor for equal payments over a fixed period.
- ROI: (Net Profit / Investment Cost) x 100, for quick screening and same-timeline comparisons
- NPV: Sum of [CF_t / (1+r)^t] - Investment, for uneven cash flows, 5+ year horizons, and M&A valuations
- Payback: Investment / Annual Cash Flow, for capital-constrained clients and risk-averse scenarios
- IRR: Rate where NPV = 0, for PE cases with hurdle rates (typically target 20-25%)
Decision Matrix: Which Metric for Which Scenario
If the interviewer does not specify which metric to use, start with payback period (fastest to calculate), add ROI for the return perspective, then offer NPV if the time horizon is long or cash flows are uneven. This shows versatility without overcomplicating the problem.
When the interviewer provides a discount rate or mentions cost of capital, that is an explicit signal to use NPV. PE and M&A contexts with hurdle rates call for IRR.
Worked Example: Technology Platform Decision
Prompt: A B2B software company must choose between two investments. Option A: upgrade existing platform for $8M, earning $3M/year for 5 years. Option B: build a new AI platform for $20M, earning $2M (Y1), $4M (Y2), $7M (Y3), $10M (Y4), $12M (Y5). Cost of capital: 12%. Negligible incremental costs.
Option A: Payback = $8M / $3M = 2.67 years. ROI = ($15M - $8M) / $8M = 87.5%. NPV = ($3M x 3.60 annuity factor) - $8M = +$2.8M.
Option B: Payback = 3.7 years (cumulative at Y3: $13M; remaining $7M / $10M Y4 = 0.7 years). ROI = ($35M - $20M) / $20M = 75%. NPV at 12%:
Synthesis: "If capital-constrained or risk-averse, Option A: faster payback (2.7 vs. 3.7 years), higher ROI (87.5% vs. 75%), lower upfront cost ($8M vs. $20M). If the client can absorb higher investment and trusts the Y4-5 projections, Option B creates $400K more value. I would stress-test Option B's NPV by reducing Y4-5 projections 20%."
Mental Math Shortcuts
Speed separates strong candidates from average ones. Memorizing a few key values lets you calculate NPV in 15 seconds instead of building a full table. The Rule of 72 (72 / rate = years to double) provides quick IRR sanity checks: at 10% growth, an investment doubles in ~7.2 years.
For equal annual cash flows, use annuity factors instead of discounting each year individually. For perpetuities, NPV = Cash Flow / Discount Rate. Example: $5M/year at 10% = $50M NPV; if it costs $40M, the investment creates $10M in value.
Annuity factors (memorize these):
Quick discount factors at 10% (approximate):
Common Mistakes in Investment Cases
Five errors that cost candidates points in investment analysis cases. Each is avoidable with awareness.
- Confusing revenue with cash flow: Use net cash flow (revenue minus all costs), not gross revenue
- Forgetting initial investment in NPV: Include the outflow at t=0 as a negative; omitting it turns a negative-NPV project positive
- Using ROI across different timeframes: 40% ROI over 2 years (20% annualized) differs vastly from 40% over 8 years (5%); annualize or switch to NPV
- Ignoring opportunity cost: Flag that $20M in Project A means $20M unavailable for alternatives
- Over-precision: Round to nearest $100K or $1M; interviewers test approach, not decimal arithmetic
Related Guides
- Break-Even Analysis Case Interview: the companion metric to payback period; use both together to frame any investment recommendation
- Consulting Math Formulas: the complete formula reference sheet
- PE Due Diligence Framework: investment analysis in private equity contexts
- Cost Reduction Case Interview: ROI applies directly when the case asks which cost reduction initiative to fund first given capital constraints
- Scale vs. Profitability Case Interview: payback period is the primary financial test for whether to invest in scaling versus protecting current margin
- Profitability Framework: where ROI analysis feeds into profitability recommendations
Sources (checked June 17, 2026)
- Hacking the Case Interview, 26 case interview formulas: hackingthecaseinterview.com/pages/case-interview-formulas
- IGotAnOffer, case interview math guide: igotanoffer.com/blogs/mckinsey-case-interview-blog/case-interview-maths
- Management Consulted, case interview formulas: managementconsulted.com/case-interview-formulas
- Corporate Finance Institute, internal rate of return: corporatefinanceinstitute.com/resources/valuation/internal-rate-return-irr
- Nucleus Research, ROI, TCO, NPV and payback guide: nucleusresearch.com/everything-to-know-about-roi-tco-npv-and-payback
- Wall Street Prep, IRR formula and calculator: wallstreetprep.com/knowledge/irr-internal-rate-of-return
FAQ
Frequently asked questions
Keep reading
Related articles
Best Free AI for Case Interview Math Practice (2026)
The free AI tools that actually run case math drills with feedback: ChatGPT, Claude, Gemini, Perplexity, and Road to Offer's Math Drill, plus the prompts, worked examples, and mental-math shortcuts that make them work.
Brain Teaser Questions: consulting interview examples with worked solutions
Practice brain teaser questions with consulting-style examples, spoken solution patterns, answer rubrics, and targeted Road to Offer drills.
Break-Even Analysis for Case Interviews: Formula, Worked Examples, and When to Use It (2026)
The complete break-even guide for case interviews: the formula, contribution margin, break-even price, margin of safety, and five fully worked numeric examples with the actual arithmetic and the sanity-check that wins offers.