Written Case Interview: BCG and Bain Format, Slide Structure, and Full Walkthrough (2026)
Written case interview guide for BCG and Bain: format, time limits, slide structure, and the Q&A tactics that separate strong from weak performers.
On this page
A written case interview in 2026 gives you a timed packet of exhibits and asks for a short recommendation you can defend in a live Q&A, no interviewer walking you through the prompt, just a stack of data and a clock. At BCG, the format typically runs a packet of 15–25 exhibits with about 2 hours (120 minutes) of independent analysis before you present; Bain's written case compresses the same task into a roughly 55-minute window. Exact packet size, timing, and slide requirements still vary by firm, office, role, and round, so always use your invitation as the source of truth. The transferable skill underneath every format is exhibit triage: scan for the 2–3 exhibits that are actually central to the recommendation, calculate only what changes that recommendation, and turn each result into one clear implication you can defend under pressure.
What a Written Case Interview Actually Tests (vs Verbal Cases)
The written case and the live case interview look similar from the outside: both involve a business problem, exhibits, and a recommendation. But they test fundamentally different skills.
In a live case, the interviewer feeds you information sequentially. They control pacing. They can redirect you if you go off track. The interaction itself provides structure. In a written case, you receive everything at once and must impose the structure yourself.
What the written case uniquely tests:
Independent triage. You will receive more data than you can possibly analyze in the time given. The test is whether you identify the 2–3 exhibits that matter and ignore the rest, not whether you covered everything.
Synthesis under time pressure. The output must be structured, insight-driven, and defensible within the allocated time window (2 hours at BCG; 55–60 minutes at Bain). Most candidates default to summarizing what the data shows. Partners want to see what the data means for the client's decision.
Written communication. Slide headlines are evaluated as communication artifacts. "Revenue declined 12%" is a fact. "Revenue decline is driven entirely by churn in the corporate segment (retention, not acquisition, is the problem)" is an insight. Partners are evaluating whether you can produce client-ready written communication under time pressure.
Oral defense under pressure. After your presentation, partners will probe your work aggressively. "You said the market is growing at 5%. Where does that come from?" "Why did you dismiss the cost reduction option?" "What happens to your recommendation if the price elasticity assumption is wrong?" This Q&A phase is where many candidates lose points they earned in the written phase.
For a comparison of how this format relates to live case scoring, see case interview scoring rubric and case interview data interpretation.
Practice the triage call, not just the reading
Independent triage is the skill the written case tests first. Drill picking the 2-3 exhibits that matter and stating the implication before you build a full written case flow.
BCG vs Bain Written Case: Key Differences
The practical difference: BCG written cases tend to emphasize your ability to communicate a clear, insight-driven story from complex data. Bain written cases often include more quantitative exhibits and expect a higher density of numerical support in your recommendation.
Both firms are evaluating the same core skill: can you take a packet of exhibits and produce a 3-slide deck with a defensible recommendation under strict time pressure?
For BCG live case preparation alongside the written component, see bcg-case-interview-guide. For Bain's full interview format including the written exercise, see bain-case-interview-guide.
The Written Case Flow
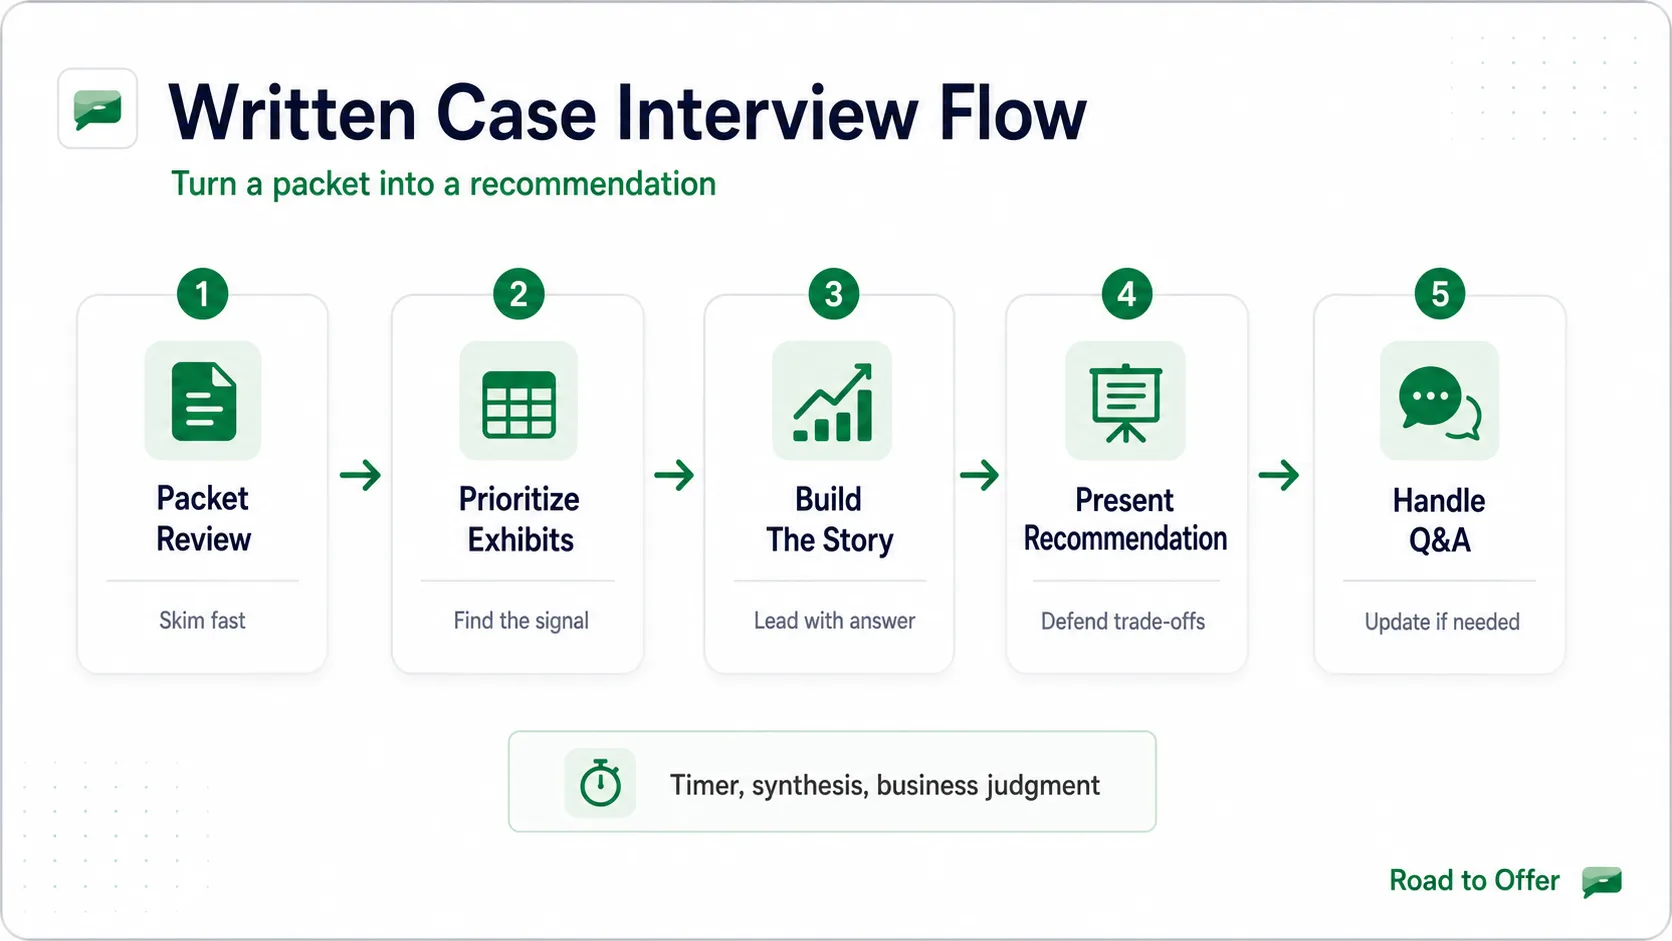
Every written case interview, regardless of firm or exhibit volume, follows the same core flow: review the packet, prioritize the exhibits that matter, build the story, present the recommendation, and defend it in Q&A. Most candidates under-invest in the early triage step and then build slides as an afterthought. Knowing the flow before you sit down changes your performance.
Phase 1: The 30-Minute Reading Strategy: What to Read and Skip
The biggest time management mistake candidates make is reading every exhibit from top to bottom before doing any analysis. By the time they finish reading, they have 30 minutes left and a pile of notes, but no synthesis.
The correct reading protocol:
Step 1: Read the question prompt (2 minutes). Before you touch the exhibits, read the problem statement, the client's objective, and the deliverable specification. This tells you what the answer needs to accomplish and which exhibits will be most relevant. If the prompt says "the board wants to decide whether to enter the European market," most of the cost structure exhibits are secondary and the market size, competitive, and regulatory exhibits are primary.
Step 2: Scan all exhibit titles and headers (3 minutes). Flip through every exhibit, reading only the title, axis labels, and any summary callouts. You are building a map: where does the relevant data live? After this step, you should be able to identify which 2–3 exhibits address the core question.
Step 3: Read the 2–3 priority exhibits carefully (7 minutes). These are the exhibits that directly bear on the client's decision. Read them carefully, annotate numbers you'll cite, and start forming your first hypothesis about what the answer is.
Step 4: Skim the remaining exhibits (3 minutes). Quickly verify whether any non-priority exhibit contradicts your hypothesis or provides essential context. If not, move to Phase 2. Accept that you will not analyze everything. This is intentional.
Which exhibits to prioritize:
Try the triage decision before opening a drill. A client asks whether to enter a new region. Exhibit A shows five years of market growth, Exhibit B shows the client's current cost base, and Exhibit C shows competitor share and channel access. Read A and C first because they test attractiveness and right to win. Keep B in reserve until the entry mode makes incremental cost relevant.
Repeat that sequence on your own practice exhibits and state the implication in one sentence with graph and exhibit drills.
Phase 2: Analysis: What Calculations Actually Matter
You have identified your 2–3 priority exhibits and formed a working hypothesis. Now you need the quantitative evidence to support or refute it.
Do fewer calculations, but do them completely. A common written case error is doing 8 partial calculations and presenting them all as supporting evidence. Partners will probe every number. If you did a calculation quickly without checking it, and the partner asks "walk me through that math," you will be exposed. Better to do 3 calculations thoroughly (state the formula, plug in numbers, check for reasonableness) and leave 5 exhibits un-analyzed.
Interpretation always follows calculation. After every calculation, write one sentence about what it means. "Revenue declined $45M year-over-year" is a fact. "Revenue declined $45M (roughly 8% of the prior year base), entirely from the corporate segment, while consumer revenue held flat. This means the issue is a corporate client retention problem, not a product or pricing problem." That interpretation is what goes on your slide headline.
Sanity-check every number. If your calculation produces a result that seems surprising (a 60% market share, a 300% revenue growth rate, an NPV that's 10x the original investment), recheck it before it becomes a slide headline. Partners have seen the data and know what reasonable looks like.
For the mental math techniques that make written case calculations faster and more accurate, see case interview frameworks complete guide.
Phase 3: Slide Structure: The 3-Slide Rule That Works
A tight three-slide core is almost always the right answer. BCG's blank-paper format allows up to five slides, so a fourth or fifth slide is acceptable when the case genuinely needs it, but candidates who build five or seven slides are usually trying to show their work rather than synthesize. Partners already know the data is complex. They want to see whether you can cut through the complexity and tell a clear story.
Slide 1: Diagnosis
What it answers: What is the problem, and what drives it?
Structure: One headline that states the diagnosis ("Profitability declined 2.1 percentage points, driven by a claims pricing lag rather than expense growth"); supporting data in the simplest form that proves the headline (a 2x2 table showing claims vs. expense contribution to margin decline); one sentence of interpretation below the chart.
What to avoid: A slide that lists five observations without saying which one matters most.
Slide 2: Recommendation
What it answers: What should the client do, and why will it work?
Structure: One headline that states the recommendation unambiguously ("Proceed with the acquisition, subject to a $420M price cap"); three supporting bullets, each with a number ("Market growing at 6% annually gives the target a strong organic revenue path"); a visual that supports the recommendation (a simple waterfall showing the value creation logic, or a 2x2 showing the acquisition vs. organic entry tradeoff).
What to avoid: Conditional recommendations ("It depends on X") without specifying what you actually recommend given the best available information.
Slide 3: Risks and Next Steps
What it answers: What could go wrong, and what should the client do immediately?
Structure: Two or three specific risks (not generic ones like "market risk" or "execution risk") with one mitigation each; two or three next steps that are actionable and time-bound ("File for rate increases in the top 5 states by premium volume within 60 days").
What to avoid: A risk slide that reads as boilerplate. If you write "Competition risk: competitors may respond aggressively," you have said nothing the client didn't already know.
For synthesis language patterns that translate directly to slide headlines, see case interview synthesis.
Phase 4: Q&A: How Partners Probe Your Written Work
The Q&A after your presentation is where written case scores diverge most dramatically. Candidates who built solid slides sometimes collapse under questioning because they never stress-tested their assumptions. Partners who have worked with this client data for weeks will probe specifically what you can't easily defend.
The three most common Q&A probes:
1. Source challenges. "Where does your market growth rate of 6% come from?" If your answer is "exhibit 4," be able to point to the specific data point and explain why you believe it's reliable. If the exhibit is a client-provided forecast, you can say: "The 6% comes from exhibit 4, which is a client forecast. I'd want to cross-check this against independent industry data before finalizing the recommendation. That would be my next step."
2. Assumption challenges. "Your NPV assumes a 10% discount rate. What happens if capital costs are higher?" Have a 30-second answer: "At a 15% discount rate, the NPV falls from $24M to approximately $14M, still positive but the case is weaker. Below a 10% IRR threshold, I'd recommend against proceeding." This shows you've thought about sensitivity.
3. Alternative interpretation challenges. "You attributed the margin decline to pricing. But couldn't it be a mix shift to lower-margin products?" Have a prepared response: "That's a fair alternative. The reason I prioritized pricing over mix is exhibit 3, which shows that gross margin declined within each product category, not just across categories. If it were purely a mix issue, we'd expect within-category margins to hold. They didn't." This shows analytical depth, not just surface-level data reading.
Prepare for Q&A by anticipating the two weakest assumptions in your analysis. Before you present, identify the two places where your logic depends on an assumption that isn't fully supported by the data. Then prepare a 30-second defense for each. Interviewers probe weak assumptions because they want to see whether you know where your analysis is solid and where it isn't.
For the communication skills that make Q&A performance stronger, see case interview communication tips.
Full Worked Example: Written Case From Prompt to Slides
Prompt: A private equity fund is considering acquiring a regional health insurance company for $800M. The company covers 480,000 members in three states. Membership has grown 12% over two years, but the combined ratio has deteriorated from 91% to 101% over the same period. The fund wants to understand whether this is a value-creation opportunity. You have 2 hours (BCG format). [Exhibit packet: 8 exhibits.]
Phase 1: Reading (12 minutes)
Reading the prompt first: the key question is whether this is a value-creation opportunity, which means the fund needs to know (a) whether the deteriorating combined ratio is fixable and (b) whether the price is right given the risk.
Exhibit map after 3-minute scan:
- Exhibit 1: Income statement, 3-year trend. HIGH priority
- Exhibit 2: Membership breakdown by state and line of business. HIGH priority
- Exhibit 3: Claims frequency and severity by line. HIGH priority
- Exhibit 4: Peer combined ratio benchmarks. Medium priority
- Exhibit 5: State regulatory environment. Low priority
- Exhibit 6: Management team bios. Low priority
- Exhibit 7: Healthcare cost inflation data. Medium priority (context)
- Exhibit 8: Comparable acquisition multiples. HIGH priority
Reading Exhibits 1, 2, 3, and 8 carefully. Skimming 4 and 7. Not reading 5 or 6 in detail.
Phase 2: Analysis (18 minutes)
Combined ratio decomposition:
Using the prompt's stated numbers: combined ratio moved from 91% to 101%, a 10-point deterioration.
- Year 1: Premiums = $680M, combined ratio 91% → claims + expenses = $619M
- Year 3: Premiums = $762M (+12%), combined ratio 101% → claims + expenses = $769M
Total cost growth: $769M − $619M = $150M. Premium growth: $762M − $680M = $82M.
Costs grew nearly twice as fast as premiums. The underwriting operation went from generating a $61M profit (Year 1: $680M − $619M) to a loss of $7M (Year 3: $762M − $769M).
Expense ratio assumption: held flat at 22% (per Exhibit 4 peer data). Therefore claims ratio moved from 69% to 79%, a 10-point swing on claims alone.
Claims driver analysis (Exhibit 3):
- Claim frequency: up 8% over two years (post-pandemic healthcare utilization normalization)
- Claim severity: up 14% over two years (medical and drug cost inflation)
- Combined claims growth: approximately 23% on the existing book
- Premium increases: only 12% (driven by membership growth, not rate increases)
Key insight: The insurer added 51,000 members but did not increase rates to keep pace with medical cost inflation. Severity grew 14%, frequency 8%, but premiums only grew 12%, and that premium growth was from volume, not pricing. This is a pricing lag problem: the insurer failed to adjust premium rates in response to rising loss costs. This type of problem is fixable through regulatory rate filings.
Comparable acquisition multiples (Exhibit 8):
- Comparable regional health insurer transactions: 8–11x EBITDA
- Current EBITDA: negative (underwriting loss of $7M, partially offset by investment income)
- Investment income estimate: 3% yield on $220M float = $6.6M
- Net income ≈ -$0.4M
The company cannot be valued on current earnings. Value the acquisition on normalized EBITDA after the pricing lag is corrected.
Normalized EBITDA calculation:
- Assume combined ratio normalizes to 93% (peer median) within 3 years
- At $800M premiums (modest growth from $762M): claims + expenses at 93% = $744M
- Underwriting profit = $56M; investment income at 3% yield on larger float = $8M
- Normalized EBITDA ≈ $64M
- Implied multiple at $800M ask: $800M ÷ $64M = 12.5x normalized EBITDA, a 14% premium to the top of comparable transactions
Phase 3: Slide Building (20 minutes)
Slide 1 Headline: "Combined ratio deterioration from 91% to 101% is a pricing lag, not a structural underwriting problem, and it is correctable within 24–36 months"
Supporting data: Claims ratio moved 10 points (69% → 79%). Severity inflation of 14% and frequency growth of 8% outpaced premium growth of 12%. Expense ratio held flat at 22%. Peer median combined ratio is 91–93%, confirming the client's current 101% reflects a temporary dislocation.
Slide 2 Headline: "Recommend proceeding with the acquisition, but only at $650M, not $800M. The current ask implies 12.5x normalized EBITDA, a 15% premium to comparable transactions"
Supporting: At $650M, the implied multiple is 10.2x, in line with the 8–11x comparable transactions in Exhibit 8. Normalization path: file for 8% rate increases in all three states in Year 1. At $762M in premiums × 1.08 = $823M Year 1 premiums. Sustained 6% increases in Years 2–3, with medical cost inflation stabilizing at 5%, yields a 93% combined ratio by Year 3. IRR at $650M entry over a 5-year hold ≈ 18%. This is an attractive return for a healthcare PE acquisition.
Slide 3 Headline: "Three risks require active monitoring: regulatory rate increase limits, continued medical cost inflation, and member attrition from repricing"
Risk 1: Two of three states have active rate review processes. Increases above 8% may be challenged or delayed. Mitigation: file for 6–8% in Year 1 (the defensible range) rather than filing for the full gap at once. Risk 2: If medical cost inflation exceeds 8% in Year 2, normalization extends a year, compressing IRR to approximately 14%. Monitor monthly loss ratios. Risk 3: Aggressive rate increases may accelerate member attrition. A 5% attrition rate offsets 40% of the revenue gain from repricing. Mitigation: combine rate increases with plan redesign to retain price-sensitive members at a different tier.
Next steps: (1) Engage actuarial firm to independently validate claims data before signing a definitive agreement. (2) Get regulatory counsel opinion on rate filing feasibility in each of the three states. (3) Counter-propose at $650M with a $50M earnout tied to Year 2 combined ratio reaching 95% or better.
Phase 4: Q&A Preparation (10 minutes)
Anticipated probes and 30-second responses:
"Your normalized EBITDA assumes a 93% combined ratio. Why not 91%?" "Exhibit 4 shows the peer median at 91–93%. I used 93% to be conservative. At 91%, normalized EBITDA is $72M and the $800M ask implies 11.1x, still at the top of comps. The conservative assumption supports the same conclusion: counter at $650M."
"What if regulators reject the rate increase filings?" "That's Risk 1. If regulators cap increases at 4% rather than 8%, normalization takes 5–6 years instead of 3, and IRR at $800M entry falls to approximately 10%, below most PE hurdle rates. This is exactly why I recommend $650M with an earnout: the lower base price protects downside if the regulatory path is slower than expected."
Common Written Case Mistakes
Reading every exhibit equally. A 20-exhibit packet cannot be fully analyzed within the time given, regardless of firm. Candidates who try end up with detailed notes on irrelevant exhibits and insufficient time to build their slides. Triage is the skill.
Building slides before knowing the headline. If you start designing the chart before you know what the chart needs to prove, you'll produce a beautiful summary that doesn't make an argument. Write the headline first, every time.
Presenting conditional recommendations. "It depends on the regulatory environment" is not a recommendation. Given the information you have, make a recommendation. Flag the conditions under which the recommendation changes. Partners want to see decision-making under uncertainty, not a refusal to decide.
Not preparing for Q&A. Candidates who build good slides and then collapse under partner questioning have done 70% of the work. The Q&A is not a formality. It is where the deepest diagnostic happens. Identify your two weakest assumptions before you present and have a 30-second defense for each.
Over-engineering the deck. Three slides with clear insights beat five slides with diluted ones. Every additional slide past three requires justification. The default should be three.
For more on how the written case connects to your overall consulting interview prep, see case interview frameworks complete guide.
Written Case Preparation Checklist
Execution checklist
Complete several timed written case exercises before your interview. The specific skills required (exhibit triage, data synthesis, slide building under time pressure) require repetition to develop. Reading about the format is not enough.
Practice writing slide headlines before building charts. This is the single habit that most improves written case quality. If you can't state the 'so what' in one sentence, you don't know what the slide is arguing.
Use official firm samples and recruiter-provided materials first. Official materials are the closest available proxy to the actual experience. Complete each one under full time pressure before adding third-party packets.
Anticipate Q&A by stress-testing your own assumptions. After each practice session, identify the two assumptions your recommendation depends on most heavily. Then write a 30-second defense of each. Partners will find these.
Time yourself strictly, no extensions. The time pressure is a core feature of the test, not an inconvenience. Practice under strict time conditions (2 hours for BCG, 55 minutes for Bain) so that the deadline feels normal rather than panicked on interview day.
Pair the checklist with focused Road to Offer practice: use exhibit drills for chart triage, math drills, and synthesis drills before you run a full timed packet.
Sources and Further Reading (checked June 17, 2026)
- BCG Application and Interview Process: bcg.com/careers/apply
- Bain Careers and Interview Preparation: bain.com/careers
- Hacking the Case Interview, Written Case Guide: hackingthecaseinterview.com/pages/written-case-interview
- Management Consulted Written Case Interview: managementconsulted.com/written-case-interview
Turn one exhibit into a defensible recommendation
Practice selecting the decision-relevant signal, checking the math, and stating the implication before you run a full timed packet.
Frequently asked questions
Resources and related guides
- Run a real case interviewPractice
- Browse all free resourcesResource hub
- Group Case Interview: How to Lead, Contribute, and Stand Out (2026)Fundamentals · Mar 7, 2026
- Accenture Salary Guide 2026 - Pay by Level and Career PathFundamentals · May 20, 2026
- PrepLounge Alternatives: Choose by Practice JobFundamentals · May 20, 2026