Reading Charts and Exhibits in Case Interviews
How to read charts, graphs, and data tables in case interviews. Covers exhibit types, common traps, a 4-step reading method, and worked examples under time pressure.
On this page
Data interpretation is the ability to extract a business insight from charts, graphs, and data tables under interview pressure. The useful distinction is not just whether you can read a chart, but whether you can connect the evidence to the client's decision. Current official preparation pages from McKinsey, BCG, and Bain all include analytical or case work, but the exact exhibit mix varies by role, office, and interview. Prepare from the materials attached to your process rather than assuming one firm's cases always follow a fixed exhibit pattern.
Why is exhibit reading its own case skill?
Exhibit reading is its own case skill because you must verify the visual, isolate the decision-relevant pattern, and speak the implication under time pressure. Three things change in an interview:
Stakes create cognitive load. You're simultaneously managing anxiety, thinking about the case, and formulating a response. This makes it easy to read too quickly, miss details, and anchor on the first pattern you see rather than the most important one.
Interviewers evaluate your process, not just your conclusion. A partner watching you interpret an exhibit is assessing: Did you read the axes first? Did you notice the footnote? Did you identify the key exception, or just the obvious trend? The interpretation you deliver out loud is as important as whether you got it right. Strong candidates deliver the non-obvious implication that goes beyond the primary trend, while weaker candidates stop at restating what the chart shows.
The format determines the exhibit task. An exhibit might arrive as part of a prompted question or during a broader case discussion. Either way, read its definitions before interpreting it and connect the evidence to the case objective. Confirm the format from your invitation and the firm's current materials. The BCG Case Interview Guide covers BCG-specific preparation; the exhibit types and worked examples below cover the transferable reading method.
How do you read a case exhibit in 45 seconds?
Use a four-step practice heuristic: frame for 10 seconds, find the pattern for 15, isolate the exception for 10, and state the implication for 10. Forty-five seconds is a training target, not a rule every interviewer enforces.
Practice reading exhibits under time pressure
Work through a complete case with charts and data tables, then connect each exhibit to the client decision.
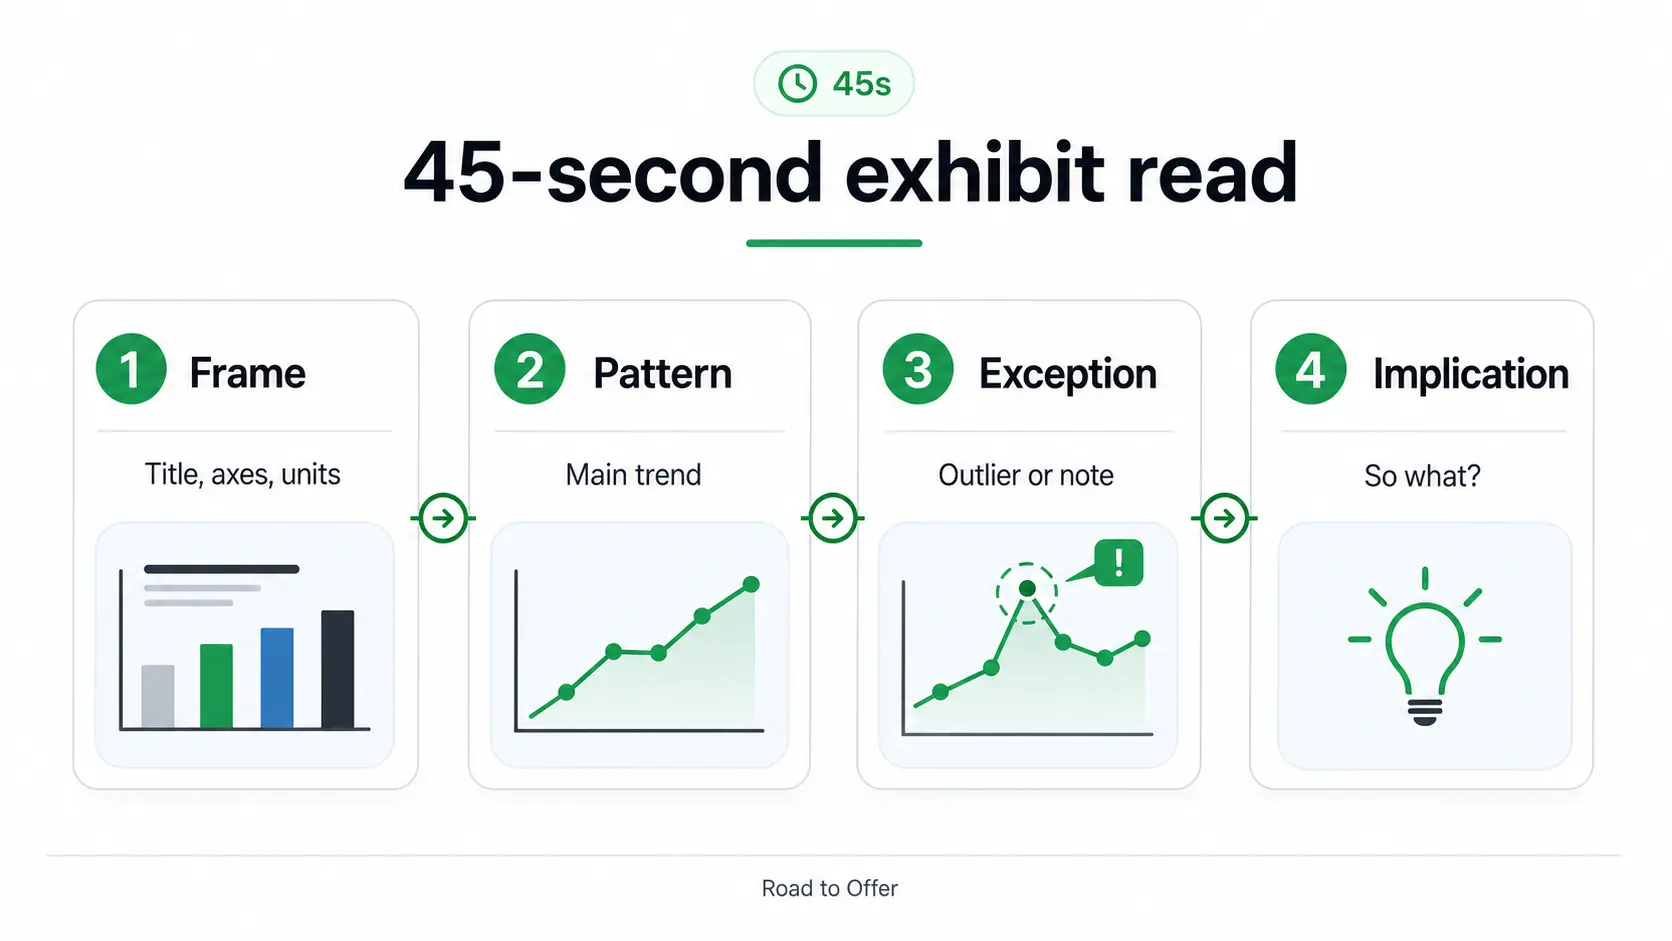
Step 1: Read the title, axes, and units (10 seconds)
Before looking at the data, read the chart title and the axis labels including units. This sounds obvious, but candidates routinely skip it when nervous.
Why it matters: The title tells you what the chart is measuring. The units tell you whether you're looking at absolute numbers, percentages, indices, or growth rates. Confusing an index with an absolute value (a common exhibit design choice in case interviews) will produce a completely wrong interpretation.
What to check:
- Titles that include qualifiers ("Top 5 Markets Only," "Excludes Asia-Pacific")
- Non-zero baselines that visually exaggerate small differences
- Logarithmic scales that compress large ranges
- Secondary y-axes on dual-axis charts
- Units: millions vs. billions, percentage vs. percentage points, index vs. absolute
Step 2: Identify the trend or pattern (15 seconds)
Look at the data as a whole. What is the main story? Is this a chart that shows a declining trend? A comparison across categories? A distribution? A correlation?
Don't try to read specific values yet. Get the shape of the story first.
Common patterns and what they suggest:
- Steady decline: Something structural is changing. Look for inflection points that indicate when the shift started
- Accelerating decline: The rate of change is worsening, which is a more urgent problem than a linear decline and suggests a compounding factor
- Category comparison: You're identifying which category is highest, lowest, growing fastest, or declining fastest
- Divergence: Two lines or bars that started similar and are now far apart. The divergence point is often the key event to explain
- Convergence: Previously separated metrics moving toward each other, which can signal commoditization or competitive catch-up
Step 3: Find the exception or outlier (10 seconds)
After finding the main trend, deliberately look for an exception or outlier: one data point or category that breaks the pattern. It may change the conclusion or expose a more useful hypothesis.
After identifying the trend, actively look for what doesn't fit. A market that's growing when all others are declining. A cost category that's flat when all others are rising. A time period where the trend reverses. A single product line that deviates from the pack.
The exception is not automatically the answer. Test whether it is large enough, reliable enough, and relevant enough to change the client decision.
Step 4: Connect to the case and state an implication (10 seconds)
Now you can speak. Lead with your implication (the "so what"), not with a description of the chart.
Weak: "This chart shows that revenue has been declining since 2022, dropping from $450 million to $380 million over three years."
Strong: "The key insight here is that revenue decline accelerated sharply in 2024. The rate of decline doubled compared to 2022-2023. That suggests a structural shift happened in 2024, not a gradual deterioration. I'd want to understand what changed that year: a new competitor, a pricing change, or a product issue."
The strong version still contains the facts, but it leads with interpretation and ends with the next analytical question. This is what a consultant does with data: they do not recite it, they advance the thinking. For a broader set of answer-first phrasing patterns, use the case interview communication guide.
Eight Common Exhibit Types and Their Traps
Most case interview guides cover bar charts and line graphs. Here are the eight chart types you'll actually encounter, including the less common ones that trip candidates up the most.
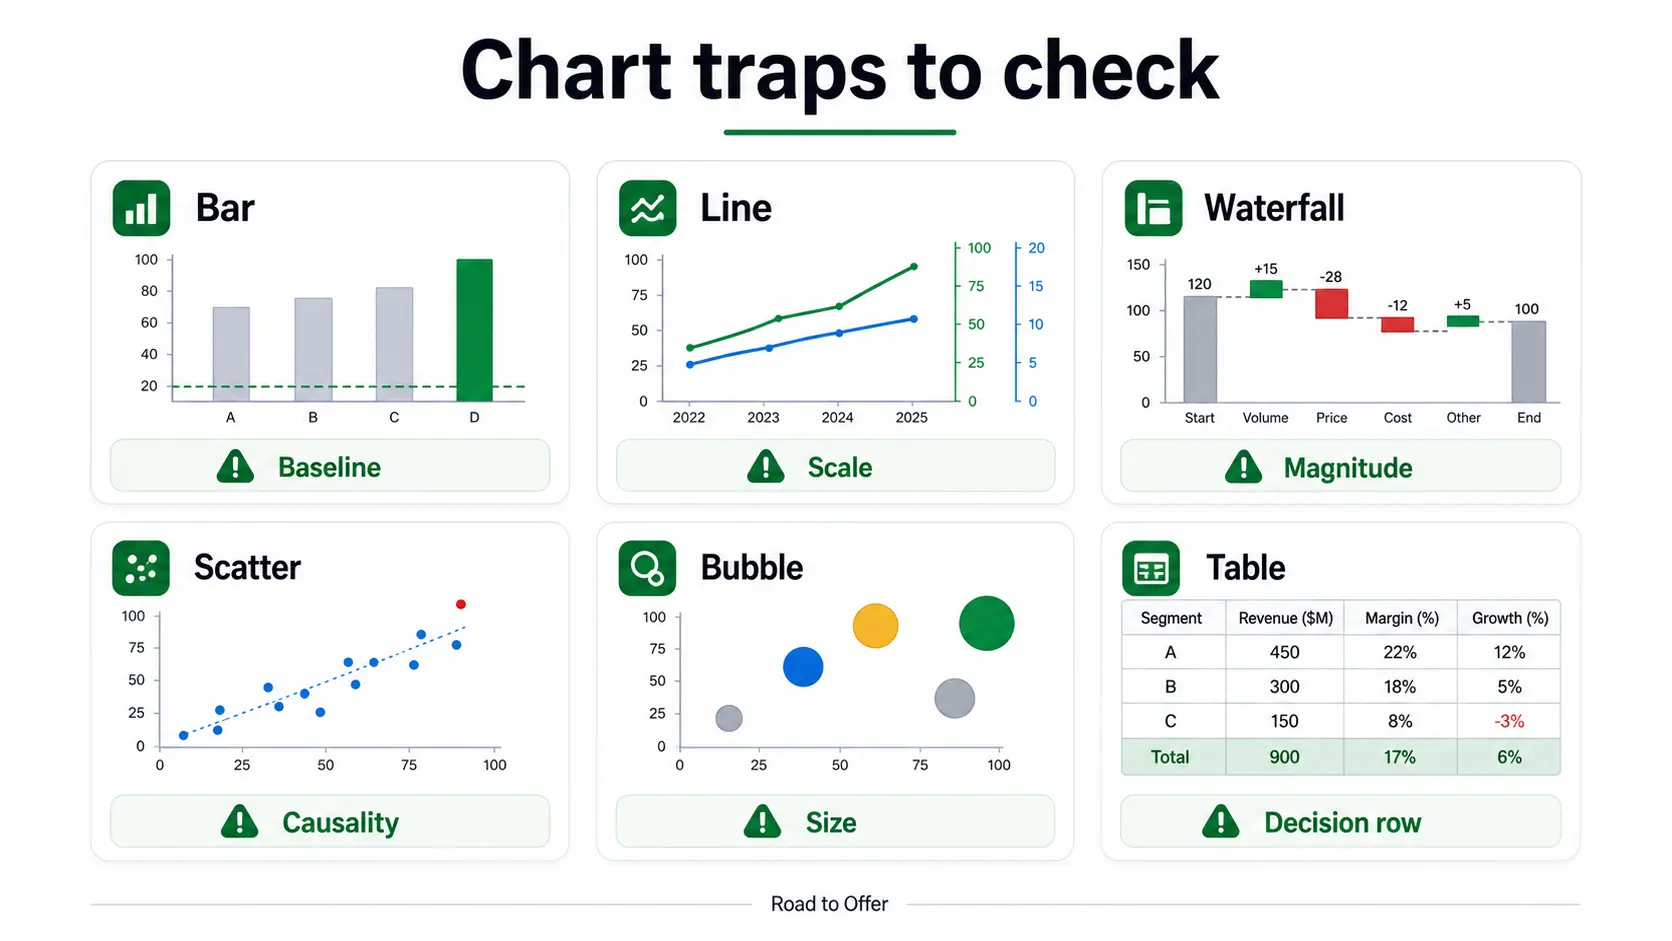
Bar Charts (Simple, Grouped, and Stacked)
What they show: Comparisons across categories or a single metric over time.
Common traps:
- Non-zero baseline. A bar chart with a y-axis starting at 80 makes a 2-point difference look dramatic. Always check whether the baseline is zero.
- Percentage vs. absolute. A chart showing 20% decline in a small market versus 5% decline in a large market has very different strategic implications. Know which metric is plotted.
- Stacked vs. grouped confusion. Stacked bar charts compare totals and composition simultaneously. Candidates frequently misread individual segments of a stacked bar because they compare segment heights rather than segment sizes (which requires subtracting the bottom boundary from the top).
How to read a stacked bar correctly: Look at total bar height first for the overall comparison, then examine individual segments by estimating their height or value from the top boundary minus the bottom boundary, not from their absolute position.
Line Graphs
What they show: Trends over time, often with multiple series on the same chart.
Common traps:
- Different scales on multiple series. Two lines that look similar in slope may have very different absolute rates of change if they're on different scales.
- Lagging vs. leading indicators. If the chart shows two metrics, one may lead the other by several periods. The relationship between them, not their individual trends, is the insight.
- Smoothed vs. raw data. Some exhibits use moving averages that can hide volatility or recent reversals.
Scatter Plots
What they show: Relationships between two variables. Often used to show correlation, or the absence of it.
Common traps:
- Correlation vs. causation. A scatter plot can only show correlation. Never say the x-variable causes the y-variable based solely on a scatter plot.
- Outliers that shift the story. One or two outlier points can anchor the visual impression differently than the main cluster suggests. Identify outliers explicitly: "Excluding the two outliers in the upper right, the relationship between X and Y is actually negative."
- Logarithmic axes. Scatter plots frequently use log scales on one or both axes. The visual impression of the relationship changes dramatically depending on the scale.
How to extract the insight: Describe the general trend (positive, negative, or no correlation), call out any outlier quadrants, and connect to what this means for the client. A scatter plot showing no correlation between marketing spend and revenue by region tells you marketing allocation is inefficient: some regions are overspending with no return.
Practice separating what a scatter plot actually shows from what it tempts you to claim.
Interactive drill set. Write an answer before revealing the worked solution, then continue into Road to Offer for scored practice and AI feedback.
Waterfall Charts (Bridge Charts)
What they show: How a starting value becomes an ending value through a series of additions and subtractions. Extremely common in profitability analysis; a typical "EBITDA bridge" shows how EBITDA changed from one year to the next.
Common traps:
- Ignoring the magnitude hierarchy. In a waterfall showing profit bridge, the largest negative contributor is usually the key finding. Candidates who discuss the items left-to-right rather than by magnitude miss the main story.
- "Other" or "unspecified" categories. A large "other" bucket is often where interesting costs are buried. If "other costs" is the second-largest negative contributor, ask what's in it.
- Confusing absolute and relative changes. A waterfall can show absolute dollar changes or percentage point changes. Misreading which one changes your interpretation entirely.
How to read a waterfall: Start with the starting value and ending value. Calculate the total change. Then identify the 1-2 largest contributors to that change (positive or negative). These are your headline findings.
Pie Charts and Donut Charts
What they show: Proportional breakdown of a whole into its parts.
Common traps:
- Poor at showing changes over time. If you're comparing two pie charts (e.g., revenue mix in 2022 vs. 2025), compare specific segments rather than trying to compare the visual shapes. The most useful insight is usually which segment grew or shrank the most.
- Misleading with many small segments. Pie charts with 8+ segments become hard to read. Focus on the top 2-3 segments and the "other" bucket.
Dual-Axis Charts
What they show: Two metrics with different scales plotted on the same chart.
Common traps: Reading both lines as if they use the same scale can create a relationship that the data does not support. Always identify which variable uses the left axis and which uses the right axis before making any comparison.
How to avoid the trap: When you see a dual-axis chart, explicitly say which axis you're referencing: "Revenue, on the left axis, has declined 15%, while customer count on the right axis has remained stable. This tells me revenue per customer is falling." Stating the axes out loud makes the comparison auditable and reduces scale errors.
Practice reading a dual-axis chart out loud, axis by axis, before combining the two lines into one insight.
Interactive drill set. Write an answer before revealing the worked solution, then continue into Road to Offer for scored practice and AI feedback.
Bubble Charts
What they show: Three variables simultaneously: x-axis, y-axis, and bubble size. Often used for portfolio analysis or market attractiveness comparisons.
Common traps:
- Ignoring the bubble size dimension. Candidates focus on the x-y position and forget that bubble size represents a third variable (often revenue, market size, or number of customers).
- Misreading the legend. Bubble size scales are not always linear. Check whether the legend shows the size for specific values.
How to read a bubble chart: Identify what each axis and the bubble size represent. Then look for clusters and outliers. A bubble in the upper-right quadrant (high on both axes) with a large size is usually the most attractive opportunity. A large bubble in the lower-left quadrant is the problem to address.
Mekko Charts (Marimekko)
What they show: Two dimensions at once. Bar width encodes one value (often total market size or segment revenue) and the stacked segment heights within each bar encode a percentage breakdown. Think of it as a 100% stacked bar chart where the bars are also different widths.
Common traps:
- Reading height while ignoring width. A tall segment in a narrow bar can represent fewer absolute dollars than a short segment in a very wide bar. The area of each block (width times height), not its height alone, reflects the absolute value.
- Comparing segment heights across bars as if they were absolute. Heights are percentages within each bar. A 40% segment in a small market and a 40% segment in a large market are the same share but very different dollar amounts.
How to read a Mekko: First read the widths to rank the categories by total size. Then read the segment heights to see the mix within each. The insight usually lives in the combination: a high-share segment inside the widest bar is where the real money is, and a high-share segment inside a narrow bar may be a niche that looks bigger than it is.
Mekko charts are the trap most candidates miss cold the first time. Run these before you see one live.
Interactive drill set. Write an answer before revealing the worked solution, then continue into Road to Offer for scored practice and AI feedback.
Worked example: a subscription app exhibit
Imagine a paid fitness app deciding whether to spend more on acquisition:
Weak answer: "Search has the most users, and referrals have the highest conversion."
Strong answer: "I would not scale search first. Referrals combine the highest paid conversion, lowest churn, and lowest acquisition cost. The constraint may be scale because referrals currently bring only 10,000 users, so I would test referral capacity before moving budget."
The spoken pattern is implication, evidence, caveat, next step. It turns several labels into a decision.
Practice building that same recommendation from the table's numbers before moving to the next exhibit.
Interactive drill set. Write an answer before revealing the worked solution, then continue into Road to Offer for scored practice and AI feedback.
Worked example: reading a margin exhibit
The exhibit: A grouped bar chart titled "Operating Margin by Product Line (2022-2025)." Four product lines (A, B, C, D) are shown across four years. Product lines A, B, and C show steady operating margins of 22-24%. Product line D shows margins declining from 18% in 2022 to 9% in 2025.
Step 1: Title, axes, and units. This shows operating margin (a percentage, not absolute dollars) by product line. Four years of data. The y-axis starts at 0%, which is correct: no baseline distortion.
Step 2: Main pattern. Three product lines are stable and healthy at 22-24%. One product line (D) is declining sharply.
Step 3: Exception. Product D is the clear outlier: not just lower margin (which was also true in 2022) but a margin that has been compressing rapidly. From 18% to 9% is a 9-point compression in three years, nearly cutting margin in half. The acceleration in 2024-2025 (a 4-point drop in the final year vs. 2-3 points in earlier years) is particularly notable.
Step 4: Implication. "The key insight is that this is not a company-wide margin problem. It is almost entirely isolated to Product D, whose margins have compressed from 18% to 9% over three years and are accelerating downward. The other three product lines are stable at 22-24%. This tells me I should focus my analysis specifically on Product D: what's happening on pricing or costs in that line that isn't affecting the others? The acceleration in the final year suggests something changed recently: a new competitor, a cost input issue, or a pricing decision."
This interpretation takes about 20 seconds and immediately focuses the case on the right problem. For more context on how to connect this kind of insight to a final recommendation, see Case Interview Synthesis.
This is also the article's own grouped bar chart in action. Run the same read on its numbers before moving to a different chart type.
Interactive drill set. Write an answer before revealing the worked solution, then continue into Road to Offer for scored practice and AI feedback.
Worked Example: Reading a Waterfall Chart
The exhibit: A waterfall chart titled "EBITDA Bridge: FY2023 to FY2025 ($M)." Starting EBITDA is $120M. The bridge shows: Volume effect +$15M, Price effect -$28M, Raw materials -$12M, Labor costs -$8M, SG&A -$5M, Other +$3M. Ending EBITDA is $85M.
Step 1: Title, axes, units. This is an absolute dollar waterfall showing EBITDA change over two years. Total decline: $35M.
Step 2: Main pattern. EBITDA declined $35M. There's one positive contributor (volume growth) that is more than offset by several negative contributors.
Step 3: Exception. The price effect at -$28M is by far the largest single contributor to the decline, accounting for 80% of the total EBITDA erosion. Volume actually grew, which means the company is selling more units at lower prices. Raw materials and labor are secondary factors.
Step 4: Implication. "The dominant driver of the $35M EBITDA decline is pricing erosion: a $28M negative price effect that overwhelms the $15M positive volume contribution. This is not a demand problem or a cost explosion. The company is growing volume but giving up margin on each unit. I'd want to understand what's driving the price compression: competitive pressure, a deliberate volume-for-price trade, or a product mix shift toward lower-priced SKUs."
Run the same bridge again on your own before moving to the math behind these charts.
Interactive drill set. Write an answer before revealing the worked solution, then continue into Road to Offer for scored practice and AI feedback.
The Chart Math: Growth Rates, Percentages, and Percentage Points
Reading the shape of a chart is half the skill. The other half is doing the small arithmetic the chart demands out loud, quickly, and without errors. Three calculations come up constantly, and each has a classic trap.
Percentage change
Percentage change is (new value minus old value) divided by the old value. Revenue rising from $400M to $450M is a 12.5% increase, because 50 divided by 400 is 0.125. The trap is dividing by the wrong base. A value that goes from 80 to 100 rose 25% (20 divided by 80), but a value that falls from 100 to 80 dropped 20% (20 divided by 100). Same 20-unit gap, different percentages, because the base changed.
Compound annual growth rate (CAGR)
When a chart shows growth over several years, do not average the yearly jumps. Use a compound annual growth rate. Suppose a market grows from $8.0B to $9.7B over 4 years. The total growth multiple is 9.7 divided by 8.0, which is about 1.21, a 21% total rise. Spread across 4 years that compounds at roughly 5% per year, because 1.05 to the fourth power is about 1.22. In an interview you rarely need the exact root. Estimating is enough: a 21% total over 4 years is "about 5% a year," and a 21% total over 2 years is "about 10% a year." State the method out loud so the interviewer sees you reaching for CAGR rather than dividing 21% by 4.
Drill the estimation move, not the exact root, until reaching for CAGR is automatic.
Interactive drill set. Write an answer before revealing the worked solution, then continue into Road to Offer for scored practice and AI feedback.
Percentage versus percentage points
This distinction is easy to state imprecisely. A margin that moves from 18% to 9% has fallen 9 percentage points, but it has fallen 50% as a margin (9 divided by 18). Both statements are true and they mean different things. Say "nine percentage points" when you mean the absolute gap and "a 50% decline in margin" when you mean the relative drop. Mixing them up, for example saying margin "fell 9%" when it actually halved, can send the case down the wrong path.
Drill percentage change and the percentage-vs-percentage-points distinction together, since they're the two calculations that get confused most often.
Interactive drill set. Write an answer before revealing the worked solution, then continue into Road to Offer for scored practice and AI feedback.
For the full set of these calculations, including market sizing and break-even shortcuts, see Case Interview Math Practice and consulting math formulas.
Footnotes and Fine Print: The Hidden Insight Source
One of the most frequently neglected parts of any exhibit is the footnotes and data notes. In case interviews, these are often where the most important methodological clarifications live:
- "Revenue excludes inter-company transfers"
- "Market data based on company estimates"
- "2025 data is preliminary / annualized from H1"
- "Includes acquisition of [company] as of Q3 2024"
- "Constant currency basis"
That acquisition footnote changes everything about how you interpret a revenue increase: it might be entirely acquisition-driven, not organic growth. A "constant currency" note means foreign exchange effects have been removed. A "preliminary" note means the most recent data point may shift. Always read the footnotes before interpreting the data.
Practice catching what each footnote type changes about the conclusion before you move on.
Interactive drill set. Write an answer before revealing the worked solution, then continue into Road to Offer for scored practice and AI feedback.
Footnotes are also a frequent source of exam-style traps in the McKinsey Solve assessment, where the Redrock Study module tests data interpretation with similar chart types and deliberate footnote-level complexity.
Which chart-reading mistakes weaken an answer?
Six mistakes repeatedly break exhibit answers:
Mistake 1: Describing instead of interpreting. "Revenue went from $400M to $350M" is a description. "Revenue declined 12.5%, with the decline accelerating in the final year, suggesting a structural shift rather than a temporary dip" is an interpretation. Always ask yourself: am I telling the interviewer what they can see, or what they should think?
Mistake 2: Stopping at the obvious trend. Name the overall pattern, then test whether an exception, inflection point, or segment changes its business meaning.
Mistake 3: Reading too many numbers. You don't need to cite every data point. The exhibit may have 30 numbers in it. Your job is to identify the 2-3 that matter most and explain why they matter.
Mistake 4: Forgetting to connect back to the case. An exhibit doesn't exist in isolation. After interpreting it, connect your finding to the case question. "This pricing erosion aligns with the competitive entry we discussed earlier and suggests the client may be in a price war they're losing."
Mistake 5: Mixing units or scale. Check whether the exhibit uses dollars, units, percentages, percentage points, indices, or customer counts. Keep the base visible before comparing rates.
Mistake 6: Ignoring notes or overclaiming causality. Read exclusions and time periods before interpreting. A relationship in a scatter plot can suggest a hypothesis, but it rarely proves cause by itself.
Practice: Building Exhibit Reading Speed
Use deliberate timed practice to improve exhibit reading. Start with 60-second drills: read an exhibit, state your key insight, and connect it to a hypothetical case question. Complete the scored Road to Offer chart rep directly below before moving back into full cases. Use the debrief to check whether you led with implication, caught key exceptions, and connected the data to the case.
Read a case exhibit and state the implication from the Road to Offer drill engine: a real prompt, your answer, and AI-scored feedback. Free account includes free daily drills.
Use a diagnose, drill, repeat loop after every miss:
If the chart reading is correct but the calculation is slow, continue with the case math lesson and case math practice. For broader quantitative support, see Mental Math for Case Interviews and consulting math formulas. To fit exhibit practice into a full prep plan, see the case interview prep guide and how to practice case interviews. If you are still learning the fundamentals of the case format, start with what is a case interview before drilling data interpretation in isolation.
Sources
All sources checked July 20, 2026.
- McKinsey case interview preparation, problem-solving evaluation including data interpretation: mckinsey.com/careers/interviewing
- BCG case interview preparation, assessment of numerical skills and data analysis: careers.bcg.com/global/en/case-interview-preparation
- Bain case interview preparation, practical judgment and data-driven analysis: bain.com/careers/hiring-process/case-interview
- PrepLounge, how to interpret charts and data in consulting case interviews (three-level observations, insights, implications method): preplounge.com/en/blog/consulting/interview/how-to-interpret-charts-and-data
- MConsultingPrep, six types of chart in case interview (bar, line, percentage, Mekko, scatter, waterfall): mconsultingprep.com/six-types-of-chart-in-case-interview
- Management Consulted, case interview charts and data interpretation: managementconsulted.com/case-interview-charts
Frequently asked questions
Resources and related guides
- Apply it in a full casePractice
- Browse all free resourcesResource hub
- Case Interview Checklist and Rubric PrepFundamentals · May 1, 2026
- Case Interview Communication: How to Think Out LoudFundamentals · Mar 1, 2026
- How Case Interviews Are Scored: What Partners Look ForFundamentals · Mar 1, 2026
- Data Science Case Interview: Complete Prep Guide for BCG X, McKinsey QuantumBlack, and Bain Vector (2026)Fundamentals · Apr 1, 2026