
Case Interview Formulas: Cheat Sheet for Profitability and Math (2026)
6 formula families cover 90% of case math: profitability, pricing, growth, breakeven, NPV, market sizing. Memorize once, drill until automatic.
On this page
Six formula families cover roughly 90% of the math in a live case: profitability, pricing and contribution margin, growth, breakeven and payback, market sizing, and investment math. What interviewers score is application, not recall: pick the right formula, set it up with units, calculate cleanly, and say what the number means while they wait. Benchmarks anchor that last step, since Damodaran's NYU Stern dataset puts gross margins at 15-25% in industrials and 60-80% in software, so a 20% margin is healthy for one and alarming for the other.
The 6 families of case interview formulas
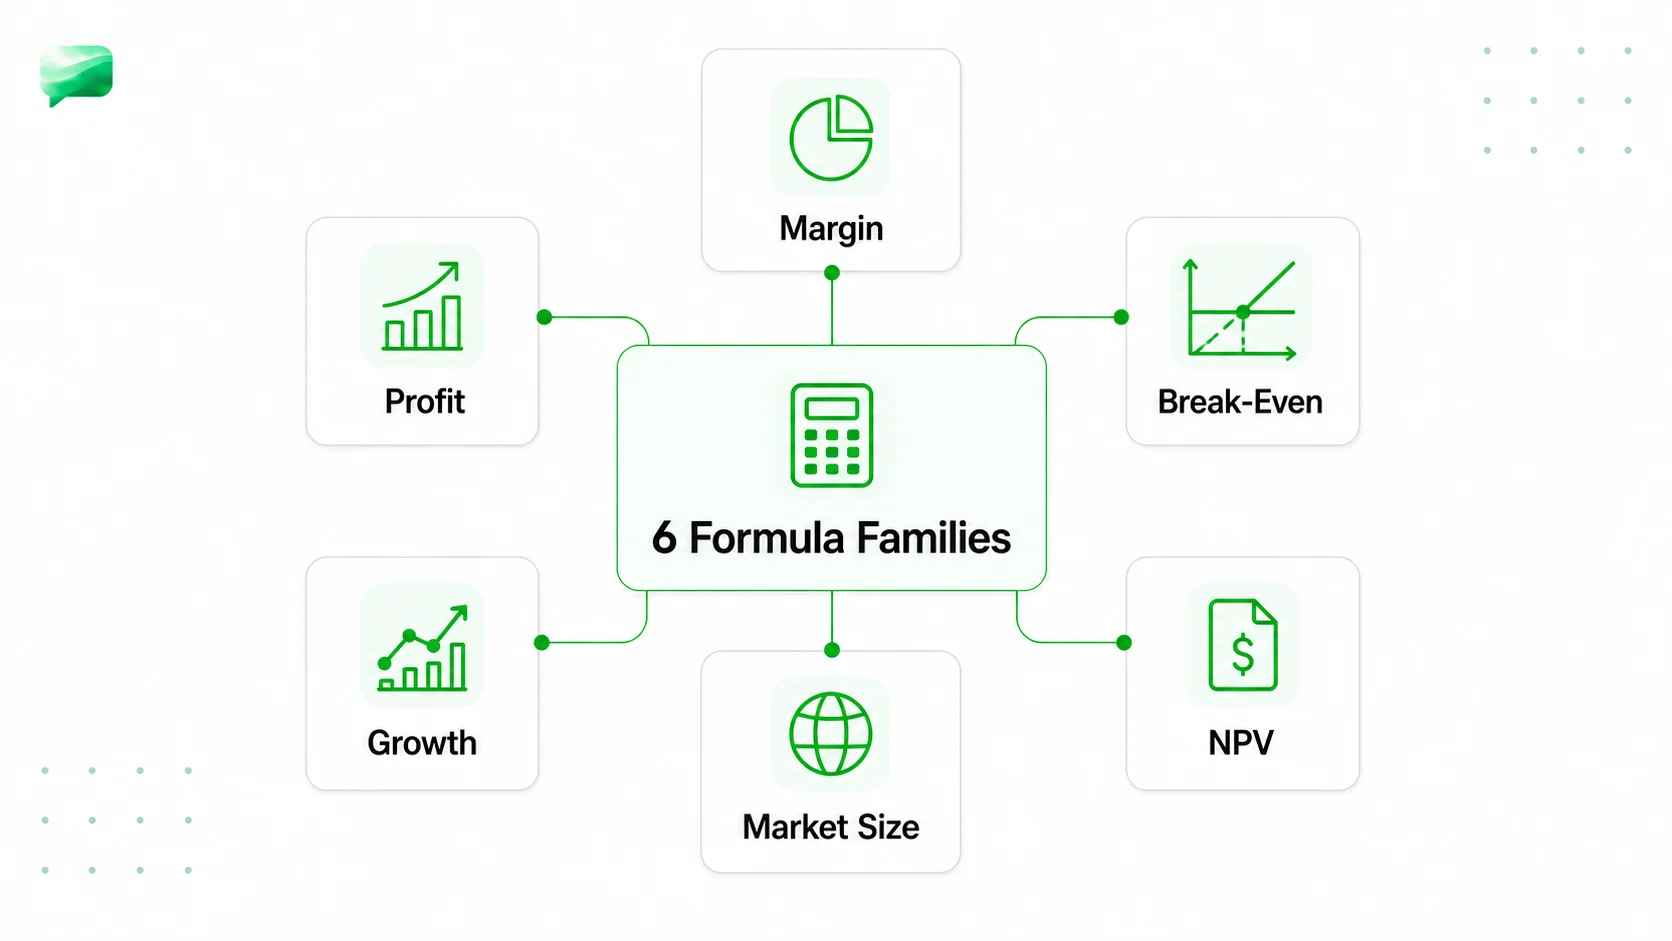
Every case math question belongs to one of six families. Knowing the family first tells you which formula to reach for before you even see the numbers. For the broader set of on-the-job formulas consultants use post-offer, see consulting math formulas. This article stays focused on formulas you need in the case room.
The six families and their typical case appearances are:
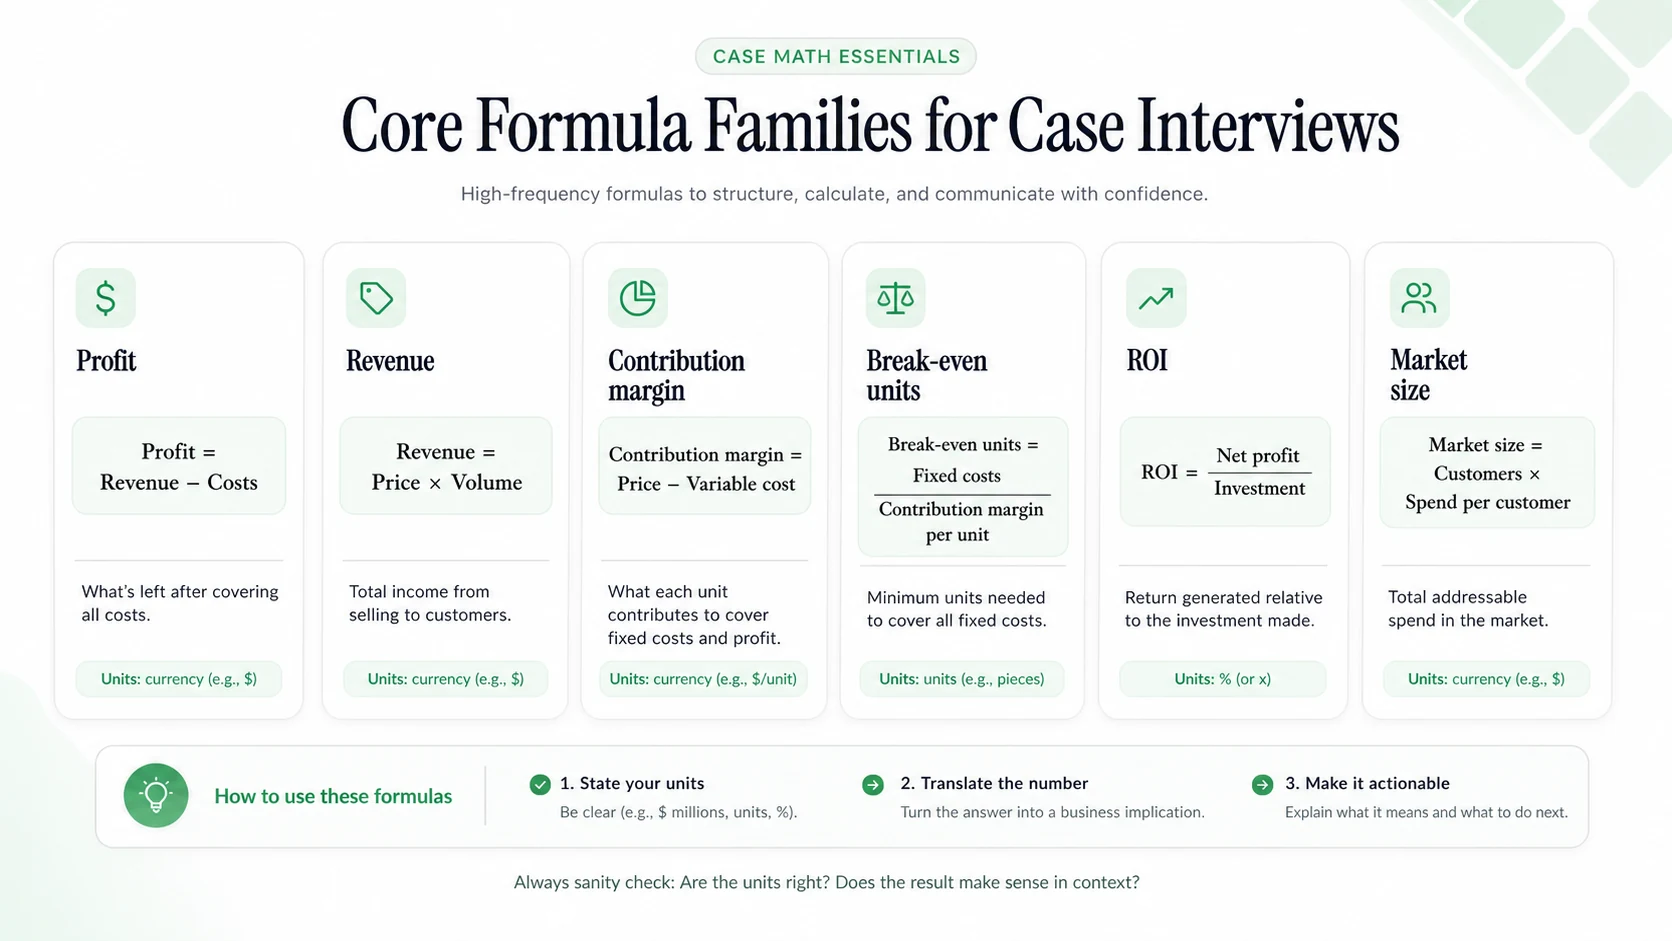
Profitability formulas (Profit, Revenue, Cost)
Profit = Revenue - Cost
Revenue = Volume x Price
Cost = Fixed Cost + Variable Cost
Gross Margin = (Revenue - COGS) / Revenue
Operating Margin = EBIT / Revenue
EBITDA Margin = EBITDA / Revenue
Market Share = Company Revenue / Total Market Revenue
Example: if revenue is $120M and cost is $96M, profit is $24M and profit margin is 20%. If profit fell, your next move is not a generic discussion of "business performance." It is a split: did revenue fall, did costs rise, or did both move?
The profit tree is the spine of almost every case. From the root equation, every interviewer expects you to disaggregate two levels deeper without being asked: Revenue splits into Volume times Price, and Cost splits into Fixed plus Variable.
In practice, a profitability case hands you a margin that has declined and asks why. Your job is to move through the tree systematically: revenue problem (volume or price?) or a cost problem (fixed or variable?)? For the full diagnostic structure, use the profitability framework guide. Damodaran's NYU Stern margin dataset shows gross margins ranging from 15-25% in industrials to 60-80% in software; knowing these ranges prevents misreading a number as good or bad.
Run the profit tree in all three directions before you move on.
Quick Math
- A client books $180M of revenue against $126M of total cost. What is its profit margin, in percent? Round to the nearest whole percent.
Margin = (Revenue - Total cost) / Revenue.
- A division books $240M of revenue at a 15% profit margin. What is profit, in dollars?
Profit = Revenue x Margin.
- The same $180M revenue business wants to lift its margin from 30% to 34%. What total cost level does that require, in dollars?
Cost = Revenue x (1 - Target margin).
Once margin math and the profit tree are automatic, the next step is applying the same setup on a real case instead of on the page.

Profitability · easy
Practice a live profitability case
CPG / Packaged Snacks
Pricing and contribution margin formulas
The contribution margin formula is the most frequently used formula that candidates underinvest in memorizing:
Contribution Margin per unit = Price - Variable Cost per unit
Contribution Margin % = Contribution Margin per unit / Price
Example: price is $50 and variable cost is $30, so contribution margin is $20 per unit and contribution margin percentage is 40%. If fixed costs are $1M, the product needs 50,000 units to break even.
These two formulas drive downstream calculations. Pricing cases (for example, "should the client raise prices by 10%?") almost always require you to calculate the new contribution margin and compare it to the volume loss needed to break even. For more price-volume reps, use Quick Math, the case interview math practice guide, and pricing strategy cases.
Take contribution margin from a price to a volume and back to a price, graded each time.
Quick Math
- A product sells for $120 with $78 of variable cost per unit. What is contribution margin, in percent? Round to the nearest whole percent.
Contribution margin percent = (Price - Variable cost per unit) / Price.
- Fixed costs are $1.47M and contribution margin is $42 per unit. How many whole units must the product sell to break even? Round up to a whole unit.
Break-even volume = Fixed cost / Contribution margin per unit, rounded up.
- A launch expects 35,000 units, $78 of variable cost per unit and $1.47M of fixed costs. What unit price breaks even, in dollars?
Required price = Variable cost per unit + (Fixed cost / Volume).
Growth and CAGR formulas
Growth rate cases ask you to project revenue or market size over time. The two formulas you need:
Percent change = (New - Old) / Old x 100
CAGR = (End Value / Start Value)^(1/n) - 1
Example: a market grows from $50B to $100B in 9 years. Since it doubled, the Rule of 72 says CAGR is about 72 / 9 = 8%. That estimate is fast, defensible, and shows numeracy without a calculator.
The CAGR formula looks intimidating, but the interviewer usually gives you round values or asks you to apply a stated growth rate. For the arithmetic techniques behind doubling, percentage change, and approximation, see case interview math mental shortcuts.
Keep doubling time, total growth and the annual rate separate under time pressure.
Quick Math
- A market compounds at 6% a year. Using the Rule of 72, how many years does it take to double? Round to the nearest 0.1 year.
Years to double = 72 / Growth rate.
- Revenue grows from $60M to $210M over the period. What is the total percent change?
Total growth = (Ending value - Starting value) / Starting value.
- Revenue grew from $250M to $360M over 2 years at a constant annual rate. What is the annual growth rate, in percent? Round to the nearest whole percent.
Growth factor = Ending value / Starting value, then CAGR = the n-year root of that factor, minus 1.
With the growth formulas locked in, the next move is running these same setups as quick scored reps instead of on the page.
Turn formulas into Quick Math reps
Practice profitability, breakeven, CAGR, and market sizing formulas as short AI-scored drills before you have to recall them in a live case.
Breakeven, payback, and ROI formulas
This family appears in pricing decisions, investment cases, and any scenario where the client is deciding whether to spend money now to earn returns later. For a full treatment of breakeven mechanics, see break-even analysis case interview; for ROI depth, see ROI and payback period case interview.
The four formulas to know cold:
Breakeven Volume = Fixed Cost / Contribution Margin per unit
Breakeven Revenue = Fixed Cost / Contribution Margin %
Payback Period = Initial Investment / Annual Cash Flow
ROI = (Gain - Cost) / Cost
ROIC = NOPAT / Invested Capital
Example: fixed cost is $2M and contribution margin is $25 per unit, so breakeven volume is 80,000 units. If the client expects only 60,000 units, the project loses money before you even discuss strategy.
The formula only counts if you can set it up, calculate it, keep units straight, and explain the implication. Run one AI-graded rep built around breakeven below, then continue into the same drill path after completion.
Apply the breakeven formula and get it scored from the Road to Offer drill engine. Answer a real prompt and get AI-scored feedback. Free accounts include 5 drills per day for the first 3 days after signup.
A common variant: the interviewer gives you a price increase and asks how much volume the client can afford to lose before the change hurts profitability. That is a breakeven question in disguise: set up the equation and solve for lost volume. To check your arithmetic while you build the habit, the breakeven calculator and CAGR calculator run the same formulas.
ROIC (Return on Invested Capital) shows up in PE diligence cases where the interviewer wants to assess operational efficiency relative to capital deployed. NOPAT is operating profit after tax, so ROIC answers a different question than breakeven: not "does this product cover its own fixed costs" but "is the capital tied up in this business earning more than it costs."
Break-even and ROIC answer different questions, so drill them in the same set.
Quick Math
- Fixed cost is $3.15M and contribution margin is $45 per unit. What is break-even volume, in whole units? Round up to a whole unit.
Break-even volume = Fixed cost / Contribution margin per unit, rounded up.
- Break-even is 70,000 units at a $45 contribution margin, but the client expects to sell only 52,000. What is the project's loss, in dollars?
Loss = (Break-even volume - Actual volume) x Contribution margin per unit.
- A business earns $27M of NOPAT on $150M of invested capital. What is its ROIC, in percent?
ROIC = NOPAT / Invested capital.
NPV and time-value-of-money formulas
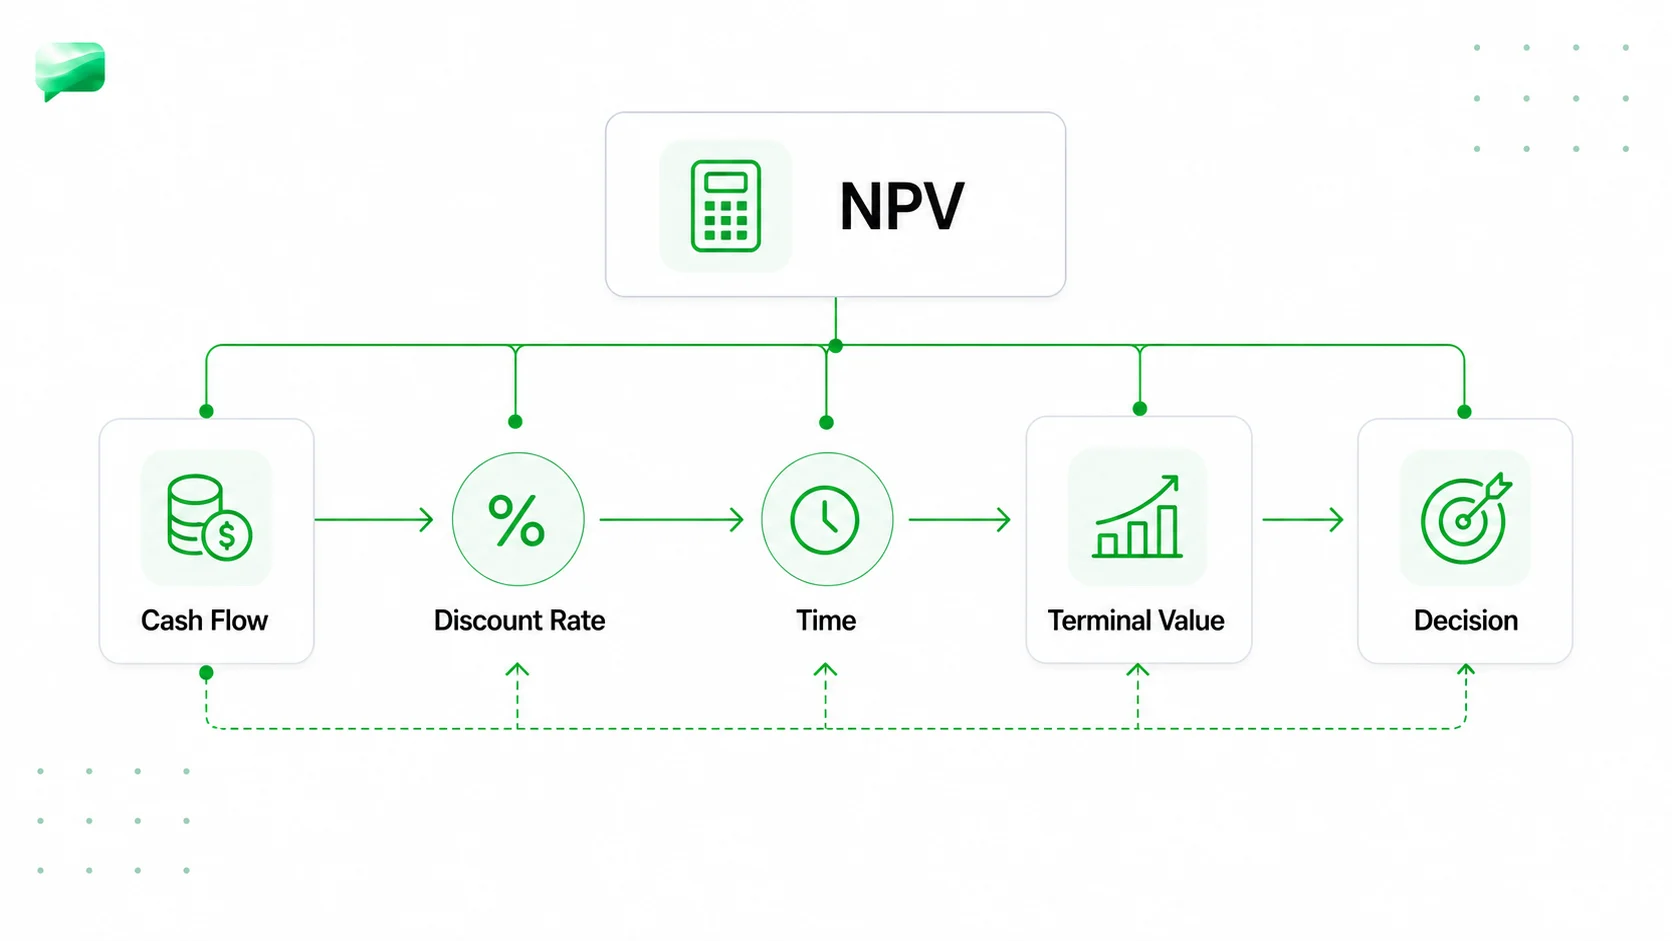
Net Present Value is the primary investment filter in capital allocation cases. Memorize the base formula and its two special cases:
NPV = Sum of [Cash Flow / (1 + r)^t] for t = 1 to n
Perpetuity value = Cash Flow / r
Growing perpetuity value = Cash Flow / (r - g)
Use the flat perpetuity when a business generates cash indefinitely at a steady rate, and the growing perpetuity when cash flows grow at rate g indefinitely.
Example: a project generates $4M per year forever and the discount rate is 10%. The perpetuity value is $40M. If the upfront investment is $30M, net NPV is $10M positive.
Per the CFA Institute's time-value-of-money refresher, the perpetuity formula is the foundation of terminal value in DCF analysis, which means it appears in PE diligence, infrastructure, and long-horizon investment cases even at the case-interview level.
The safe strategy: memorize the NPV formula and both perpetuity variants regardless of target firm. For PE-focused or restructuring interviews (Bain Capital, Parthenon, A&M), NPV fluency is required, not optional.
Perpetuity, NPV and the growing variant, in the order an interviewer asks for them.
Quick Math
- A project generates $6M a year forever at a 12% discount rate. What is the perpetuity value, in dollars?
Perpetuity value = Cash flow / Discount rate.
- A project has a $50M perpetuity value and a $38M upfront investment. What is the NPV, in dollars?
NPV = Perpetuity value - Upfront investment.
- A $6M annual cash flow grows at 4% forever and is discounted at 12%. What is the growing perpetuity value, in dollars?
Growing perpetuity value = Cash flow / (Discount rate - Growth rate).
Market sizing shortcuts and ratios
Market sizing cases use a two-path structure. Choose the path based on which anchor number the interviewer gives you (or which one you can estimate more confidently):
Top-down: Market Size = Population x Penetration x Frequency x Average Price
Bottom-up: Market Size = Units (stores, customers, firms) x Revenue per Unit
Example: 10M people x 20% penetration x 4 purchases per year x $25 average price = $200M annual market. The exact estimate matters less than whether every assumption has a visible reason.
The full methodology is covered in the market sizing framework guide, and the market sizing questions bank gives you worked examples to test the formulas. For the formula-focused view: the top-down path works when you know population and can estimate penetration. The bottom-up path works when you can anchor on a single unit (one store, one customer) and count up.
Common benchmarks worth memorizing for quick estimation:
These ranges come from Damodaran's sector dataset and standard SaaS benchmarks. When a case gives you a margin figure, they tell you whether you are looking at a healthy or distressed business without needing to ask the interviewer for context.
Build and defend a market estimate from the Road to Offer drill engine. Answer a real prompt and get AI-scored feedback. Free accounts include 5 drills per day for the first 3 days after signup.
Apply the Formulas: Three Mixed Reps
Each rep below needs two formulas from the tables above, not one.
Quick Math
- A product sells at $90 with $65 of variable cost and $600K of annual fixed costs. After a 10% price cut, how many whole units are needed to break even? Round up to a whole unit.
Apply the price cut to get the new contribution margin, then Break-even volume = Fixed cost / New contribution margin, rounded up.
- A project costs $14M today and returns $4M a year. What is the payback period in years? Round to the nearest 0.1 year.
Payback = Investment / Annual cash flow.
- A customer spends $25 a month at a 40% margin and churns after 24 months. Acquisition cost is $80. What is the LTV/CAC ratio? Round to the nearest 0.1x.
LTV = Monthly spend x Margin x Months retained, then LTV/CAC = LTV / Acquisition cost.
Build your 1-page memorization sheet and drill it
The most effective memorization approach is a single-page reference sheet you write yourself, organized by the six families rather than by formula name. Build it in this order: profit tree first, then contribution margin, then breakeven, then growth/CAGR, then market sizing paths, then NPV/perpetuity. The order matches case frequency.
For mental math speed (rounding, percentage estimation, and approximation mechanics), see case interview math mental shortcuts and mental math for case interviews. Those articles cover the calculation techniques; this one covers what to calculate.
The drilling protocol: write each formula from memory, then run short problems where you apply it, timing yourself to 60 seconds once recall is solid. The bottleneck is almost never formula recall. It is translation speed: seeing a scenario and knowing which formula fits. That skill comes from repetition, not another passive read-through.
Drill the six formula families and get scored
Run math drills that mix breakeven, CAGR, market sizing, and NPV setups, and get scored on setup, calculation, and implication.
Sources and Further Reading (checked 2026-05-01)
- McKinsey Careers, Tips for the case interview: https://www.mckinsey.com/careers/interviewing
- BCG Careers, Interview prep: https://careers.bcg.com/case-interview-preparation
- Management Consulted, 2025 Case Type Distribution: https://managementconsulted.com/case-interview/
- Damodaran (NYU Stern), Margins by sector dataset: https://pages.stern.nyu.edu/~adamodar/New_Home_Page/datacurrent.html
- CFA Institute, Time Value of Money refresher: https://www.cfainstitute.org/insights/professional-learning/refresher-readings
Frequently asked questions
Resources and related guides
- Start free consulting drillsPractice
- Browse all free resourcesResource hub
- Break-Even Analysis for Case Interviews: Formula, Worked Examples, and When to Use It (2026)Math And Quant · Mar 20, 2026
- Case Interview Math Practice: 12 Graded Mental Math DrillsMath And Quant · Feb 6, 2026
- Case Interview Math: Mental Shortcuts to Calculate FasterMath And Quant · Mar 1, 2026
- Michigan Ross Case Book: Formula-Led Profitability PracticeMath And Quant · Jul 18, 2026
- NPV and Discounting in Case Interviews: The Shortcut-First Guide (2026)Math And Quant · Jun 28, 2026
- Numerical Reasoning Test for Consulting (2026): Format, Question Types & How to PassMath And Quant · Jun 28, 2026