
Driver Tree: Case Interview Examples, Math, and Pitfalls
Learn how a driver tree decomposes profit, revenue, and cost into measurable levers, with a fully worked numeric example, when to use it instead of an issue tree, and the mistakes that cost candidates the case.
On this page
A driver tree in a case interview decomposes one measurable metric into the levers that mathematically produce it. Profit becomes revenue minus cost. Revenue becomes price times volume. Volume becomes customers times purchase frequency. The point that separates a strong answer from a memorized diagram is the arithmetic: because every node connects to its parent by an operation, a change in any input traces cleanly to the output, and you can prove which lever broke instead of guessing. Official firm interview pages from McKinsey, BCG, and Bain all point candidates toward structured, quantitative problem solving, which is exactly what a good driver tree demonstrates. The case interview frameworks complete guide shows how driver trees and issue trees underlie the profitability, market entry, and M&A frameworks you meet across MBB interviews.
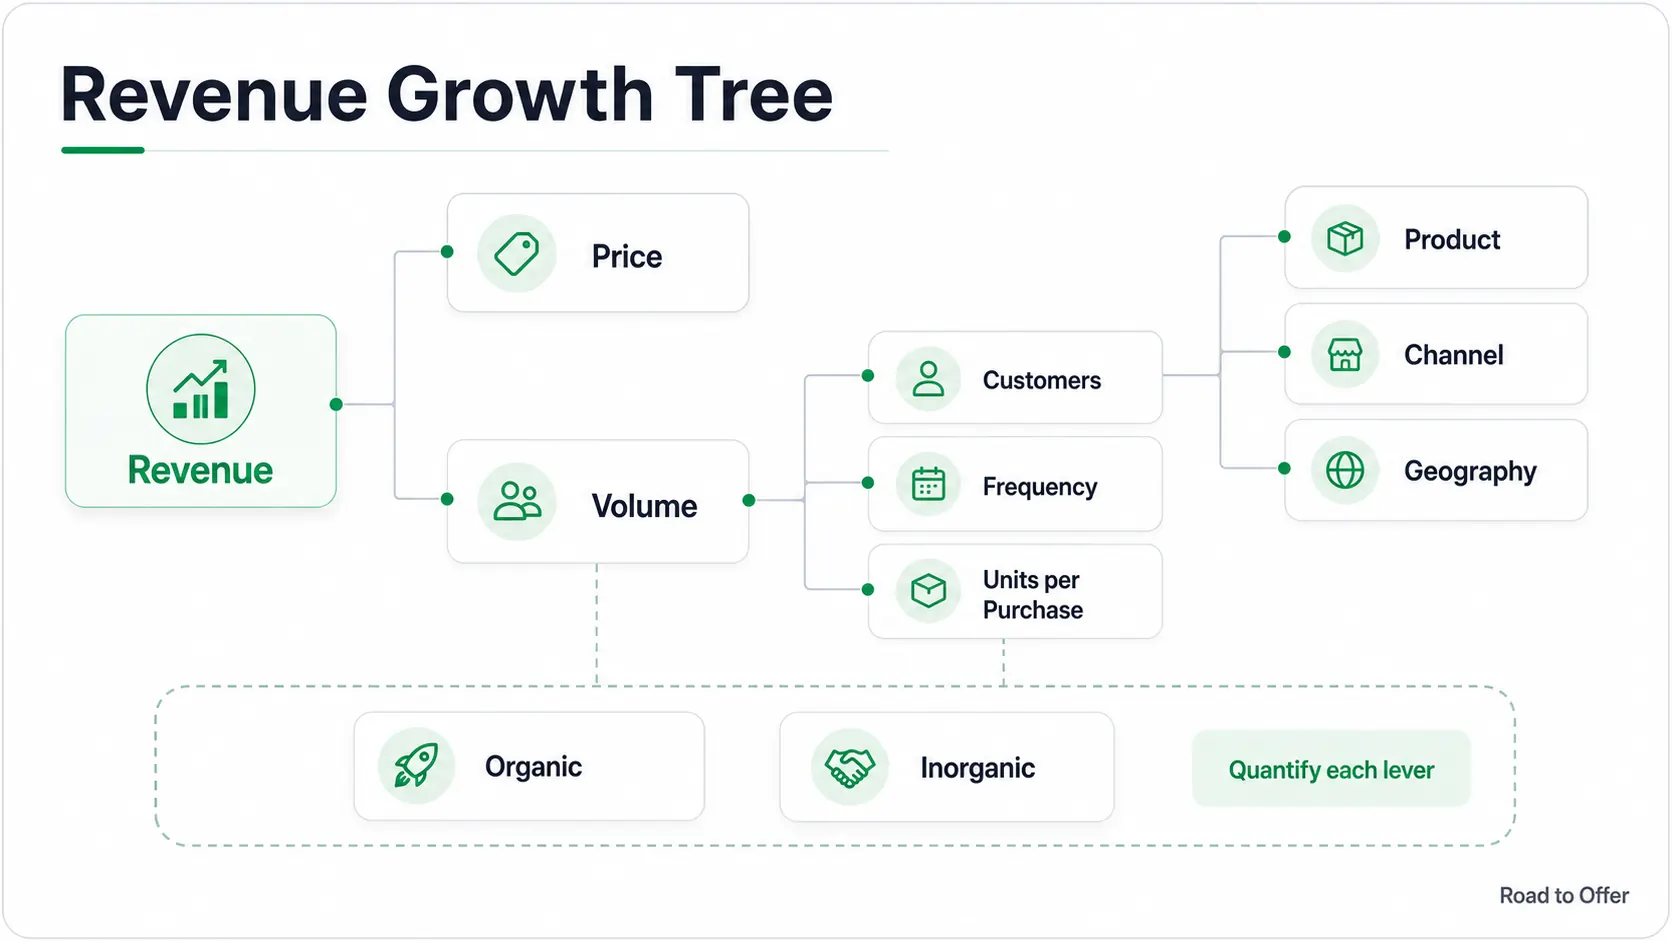
What is a driver tree in a case interview?
Picture the client objective at the top of the page. Under it you place the levers that combine to produce it. Under each lever you add the subdrivers that explain movement in that branch. The distinctive feature of a driver tree, the thing that sets it apart from a loose list of factors, is that the branches are connected by math.
For a profitability case the relationships are exact:
- Profit = Revenue minus Cost
- Revenue = Price times Volume
- Volume = Number of customers times Purchase frequency
- Cost = Fixed cost plus Variable cost, where Variable cost = Unit cost times Volume
Because the tree is arithmetic, it does two jobs at once. It organizes your thinking, and it quantifies impact. If volume drops 10 percent and price holds, you can say revenue drops 10 percent before you ever see an exhibit. That is why consultants use driver trees on real engagements, not just in interviews.
The labels matter less than the logic. A tree that lists revenue, cost, and customers looks clean but overlaps, because customers already sit inside revenue. A cleaner version keeps each node mutually exclusive and rebuilds the parent exactly. The MECE principle is the test: branches should not double count, and together they should reconstruct the metric above them.
Practice building a MECE tree live from the Road to Offer drill engine. Answer a real prompt and get AI-scored feedback. Free accounts include 5 drills per day for the first 3 days after signup.
Where did the driver tree come from?
The driver tree is older than management consulting. Around 1912, an engineer at DuPont named Donaldson Brown built a model to explain the company's Return on Equity by splitting it into three multiplied parts: net profit margin, asset turnover, and financial leverage. Multiply the three and you get back ROE. Change one and you can see exactly how the headline return moves.
That DuPont model is the original driver tree, and it carries the same lesson interviewers test today. A good decomposition is not a list. It is a set of inputs that, when combined with the right operation, rebuild the number you started with. If your branches do not multiply or add back to the parent, you have an issue tree, not a driver tree.
Driver tree vs issue tree: which one and when?
A driver tree and an issue tree are related but answer different needs. A driver tree decomposes a number with arithmetic. An issue tree organizes the questions or hypotheses you need to test, using categories rather than equations.
In practice the two work in sequence. An issue tree frames whether a profit decline is a revenue problem or a cost problem. A driver tree then quantifies whether price, volume, or a specific cost line drove it. Issue trees support hypothesis generation. Driver trees support hypothesis testing with numbers. Use a driver tree when the case asks why a metric changed or how to improve it. Use an issue tree when the problem is broader: should we enter a market, launch a product, respond to a competitor, or change the operating model.
If you are still learning the distinction, the issue tree case interview guide walks through the categorical version, and the structured thinking guide covers both before timed practice.
Worked example: tracing a profit decline through the math
This is where most driver tree guides stop short. They draw the branches but never run the numbers. Here is the full arithmetic.
A regional coffee chain ran 100 stores last year and earned 12 million dollars in profit. This year profit fell to 8.4 million, a drop of 3.6 million, or 30 percent. The client wants to know which lever broke. Start with the per store unit economics from last year:
- Customers per store per day: 400
- Average ticket (price): 5.00 dollars
- Days open per year: 360
- Annual revenue per store: 400 times 5.00 times 360 = 720,000 dollars
- Variable cost per customer: 2.00 dollars, so variable cost per store = 400 times 2.00 times 360 = 288,000 dollars
- Fixed cost per store per year: 312,000 dollars
- Profit per store: 720,000 minus 288,000 minus 312,000 = 120,000 dollars
- Total profit: 120,000 times 100 stores = 12,000,000 dollars. That ties out.
Now isolate one branch at a time using this year's data. Suppose price held at 5.00 and fixed cost per store held at 312,000, but average customers per store per day fell from 400 to 360, a 10 percent traffic decline.
- New revenue per store: 360 times 5.00 times 360 = 648,000 dollars
- New variable cost per store: 360 times 2.00 times 360 = 259,200 dollars
- New profit per store: 648,000 minus 259,200 minus 312,000 = 76,800 dollars
- New total profit: 76,800 times 100 = 7,680,000 dollars
A 10 percent traffic drop alone takes profit from 12 million to 7.68 million. That is most of the gap, but not all of it. The remaining shortfall to 8.4 million, plus the small offset, points you to a second branch. If the chain also opened a few low traffic stores or fixed costs crept up, the tree tells you exactly how much each explains. The lesson: traffic, a single volume input, was the dominant driver, and the math proved it rather than your intuition.
The tree let you change one input, hold the rest, and read the impact straight off the arithmetic. That is the difference between a candidate who says "maybe volume fell" and one who says "a 10 percent volume drop explains a 36 percent profit decline because fixed costs do not flex, so volume is my priority branch." For more reps, the case interview formulas and profitability framework guides give you the building blocks, and the revenue decline case interview walkthrough applies the same decomposition to a top-line drop. To pressure-test your math under interviewer questions, run a quick math drill before the full case.
Build a driver tree in a real case
Run a full AI-guided case where your tree has to survive exhibits, math, and interviewer pushback, then synthesize the broken branch into a recommendation.
What are the main driver tree templates?
Here are practical templates you can adapt out loud. Each one rebuilds its parent metric with arithmetic.
Profitability driver tree: Profit equals revenue minus cost. On revenue, test customer volume, purchase frequency, price, and mix. On cost, separate fixed from variable, then the largest operating categories. This is the most common tree in interviews because most prompts hinge on a profit change.
Revenue driver tree: Revenue equals number of customers times units or usage per customer times average price, adjusted for mix. For a subscription or repeat purchase business, also break out acquisition, conversion, retention, and expansion. The revenue growth case interview guide pushes each of these branches further.
Cost driver tree: Cost equals fixed cost plus variable cost. Then examine labor, inputs, distribution, site costs, capacity utilization, and process efficiency. The skill is not listing cost lines, it is asking which line changed, whether the change is structural, and whether it scales with volume. The cost reduction case interview guide and operations cost framework branch the cost side down to operational levers.
Growth driver tree: Growth comes from acquiring more customers, retaining more existing customers, increasing usage, improving price realization, expanding channels, and changing mix. For demand heavy branches, market sizing trains the same decomposition muscle.
Market entry economics tree: Do not use a pure driver tree for the full decision. Use an issue tree for market attractiveness, ability to win, economics, and risks, then drop a driver tree inside the economics branch for revenue, cost, required investment, and path to profitability.
Worked example: building a tree from a messy prompt
Prompt recap: an EV charging hub operator has expanded into several urban locations, but profitability is below expectations. The client wants to know what is happening and what to do next.
A strong opening sounds like this. I would diagnose profitability by separating revenue and cost. On revenue, I would look at charger utilization, customer traffic, session length, price per session, customer mix, and downtime. On cost, I would examine site lease costs, energy costs, maintenance, labor, payment fees, and fixed infrastructure. My first hypothesis is that utilization and downtime are the highest priority branches, because charging hubs depend heavily on asset usage. If utilization is low or chargers are unavailable at peak demand, profit falls even when pricing looks reasonable.
That is a useful driver tree because it is specific to the business. It does not stop at revenue and cost. It translates revenue into the mechanics of an EV charging hub, and each branch is something you can put a number against. The next data requests stay narrow:
- Revenue by location, split into number of sessions, average session value, and utilization
- Charger uptime and downtime by location
- Energy cost and lease cost by location
- Customer mix across commuters, fleet users, and destination shoppers
- Peak versus off peak usage patterns
The interviewer hears three things: you understand profitability, you understand the business model, and you know which evidence would move the case forward. To rehearse this opening, a free structure drill turns a messy prompt into clean branches, a priority hypothesis, and a sharper data request.
What should I check before using a driver tree?
Run this checklist in the opening minute of the case.
- Is the client asking about a measurable outcome such as profit, revenue, cost, adoption, capacity, utilization, retention, or growth?
- Do I need to explain why performance changed, or how to improve it?
- Can each branch be tested with a number?
- Do the branches rebuild the parent metric, or do they overlap?
- Would the branches make sense for this specific business model, or am I recycling a generic tree?
- Would a broader issue tree be cleaner first?
If the early answers are yes, a driver tree is likely the right tool. If the case is about choosing a market, defending against a competitor, or deciding whether to launch a product, start broader and drop a driver tree inside the economics or operations branch.
What are the most common driver tree mistakes?
The first mistake is forcing profitability onto every prompt. Profitability trees are useful but not universal. A pricing case may need willingness to pay, competitor response, segmentation, and channel behavior. A market entry case needs attractiveness and right to win before economics.
The second mistake is overlapping branches. If revenue splits into customers, price, and retention, the customer and retention branches double count unless you define them carefully. Better: new customers, retained customers, usage per customer, price, and mix, which add back to revenue without overlap.
The third mistake is stopping at labels. Interviewers do not reward a tree because it looks familiar. They reward it when the branches reveal judgment. Revenue is a label. Utilization per charger, paid sessions per day, price realization, and downtime are drivers you can measure.
The fourth mistake is skipping the arithmetic. A driver tree that never produces a number is just an issue tree wearing a math costume. The candidate who says "a 10 percent volume drop explains a 36 percent profit fall" beats the one who lists branches and waits for the exhibit.
The fifth mistake is treating the tree as the answer. The tree is a hypothesis map. Once the data points to the broken branch you still need to synthesize what it means and recommend the next move. The case interview synthesis guide covers that final step.
How do I build driver-tree fluency?
Start untimed. Take a case prompt, write the objective at the top, build the first layer, and force each branch to rebuild the parent with arithmetic. For a snack brand profitability reset, do not stop at revenue and cost. Revenue includes price, volume, channel mix, product mix, distribution, and repeat purchase. Cost includes ingredients, packaging, trade spend, logistics, and manufacturing efficiency. Then put rough numbers on two branches and check that they tie back to the top line.
Then do timed reps with three outputs in mind: clean branches, a priority hypothesis, and a narrow data request backed by one number. Practice the hypothesis driven approach so the tree leads to a claim, not a list. If you are switching into consulting from another field, the case interview prep for career changers guide places driver trees inside a realistic ramp.
You can build this on Road to Offer with a free structure drill, then stress test it in a full AI-guided case where the tree has to survive exhibits, math, interviewer pushback, and final synthesis.
Build a driver tree live from the Road to Offer drill engine. Answer a real prompt and get AI-scored feedback. Free accounts include 5 drills per day for the first 3 days after signup.
If you need a broader training sequence, the case interview prep guide places driver trees inside the rest of your plan.
Sources and Further Reading (checked June 18, 2026)
- McKinsey & Company - Interviewing
- Boston Consulting Group - Interview Prep
- Bain & Company - Our Hiring Process
- Hacking the Case Interview - Driver Tree Complete Guide
- CaseBasix - Issue Tree vs Driver Tree
- Caseinterview.com - Identifying Key Drivers in a Case Interview
- Harvard Business School - How to Prepare for Consulting Recruiting
Frequently asked questions
Resources and related guides
- Practice driver trees in a real case interviewPractice
- Browse all free resourcesResource hub
- First Principles Thinking Framework for Case InterviewsFrameworks · Jun 1, 2026
- Ansoff Matrix vs BCG Matrix for Case InterviewsFrameworks · Jun 2, 2026
- Cost-Benefit Analysis Framework for Case InterviewsFrameworks · Jun 1, 2026
- Private Equity Case Interview: LBO, Screening, and CDDFrameworks · Mar 15, 2026