BCG Matrix Explained: Stars, Cash Cows, Question Marks, Dogs (2026)
Learn the BCG growth-share matrix for case interviews: how to calculate relative market share and market growth, place each business unit, and turn the 2x2 into a portfolio recommendation. Full worked example included.
On this page
The BCG Matrix, also called the growth-share matrix, is useful in case interviews when the client has multiple products or business units and needs to decide where to invest, harvest, or divest. Your answer should classify the portfolio, explain the cash logic behind each quadrant, then pressure-test the recommendation with economics, industry attractiveness, and capability fit.
Do not use it for a single-product profitability decline or a generic growth question. Use it when the case is really about capital allocation across a portfolio: which businesses should fund the company, which deserve investment, and which should be exited.
What Is the BCG Matrix and Why Is It a 2x2?
The underlying logic: businesses in high-share positions benefit from the experience curve. Accumulated production volume can reduce costs over time, creating a structural cost advantage for the market leader. The portfolio implication is that high-share businesses generate surplus cash, which should be reinvested into high-growth opportunities.
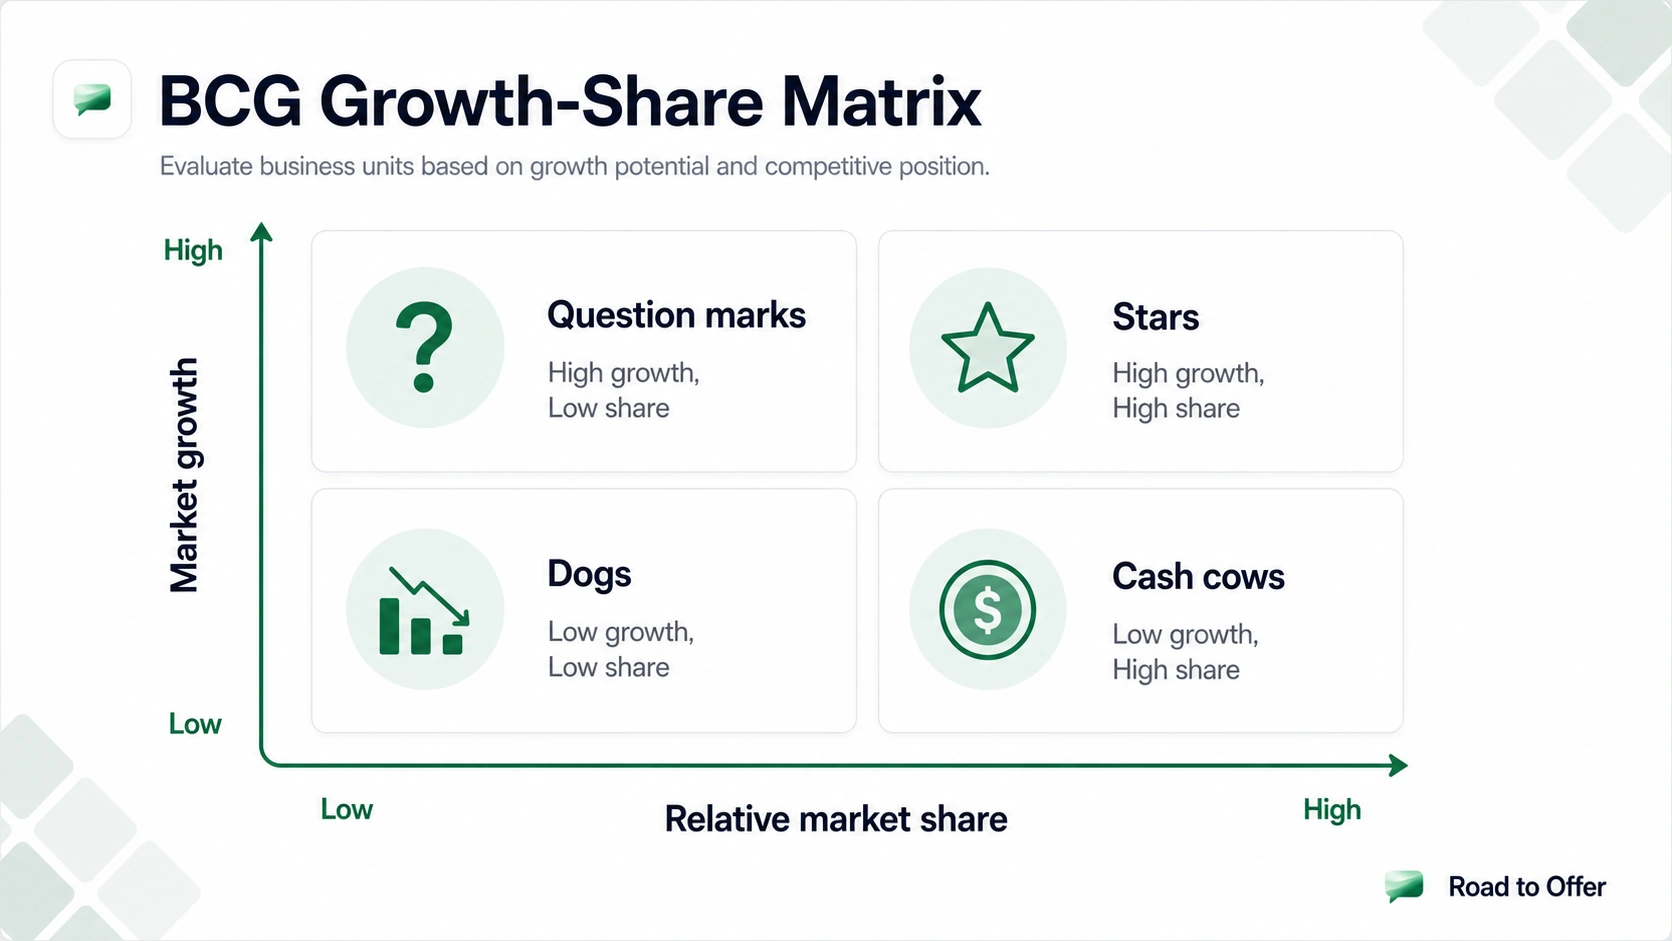
The two axes:
- Y-axis (Market Growth): High growth signals attractive demand and usually requires investment; low growth signals a mature market. The conventional cut-off is 10% annual market growth, but it is a convention, not a law, so set the boundary to fit the industry.
- X-axis (Relative Market Share): Your market share divided by the largest competitor's share. The high/low boundary is usually drawn at 1.0x. Above 1.0 means you lead the market; below 1.0 means you trail it. Some textbooks draw the line at 1.5x to require a clear leader rather than a narrow edge.
A quick note on history, because BCG interviewers occasionally ask: Bruce Henderson created the matrix at BCG in 1968, and it was popularized in his 1970 essay "The Product Portfolio." At its peak it was used by about half of the Fortune 500. The framework is still taught in every strategy course, which is exactly why interviewers expect you to know where it breaks down, not just recite the quadrants.

Learn the case method, step by step
What Do the Four Quadrants Mean?
Stars
Stars are the portfolio's future cash generators. The paradox: they look profitable (high revenue, growing market) but are often cash-neutral or slightly cash-negative because the growth rate demands continuous reinvestment to maintain share.
Cash flow logic: High growth, so competitors are also investing aggressively, so you must match their investment to hold share, so net cash flow is roughly zero even with strong profitability.
Strategic priority: Do not underfund Stars. Companies that harvest Stars prematurely lose market leadership just as growth slows and end up with a Dog instead of a Cash Cow.
Coca-Cola example: Dasani bottled water (high market share in a still-growing international bottled water market) fits the Star profile. Coca-Cola continues investing in distribution and marketing.
Cash Cows
Cash Cows are the portfolio's funding engine. Market growth has slowed (the market is mature), but the company's entrenched market share means it earns more than competitors with less incremental investment.
Cash flow logic: Low growth, so competitors have stopped investing aggressively, so you can reduce marketing and capex investment and still maintain share, so net cash flow is strongly positive.
Strategic priority: Extract cash efficiently. Avoid the trap of over-investing in a Cash Cow's growth, because the market cannot absorb it. Use the surplus to fund Question Marks and Stars.
Coca-Cola example: The "Coca-Cola" brand in its core carbonated soft drink segment is a textbook Cash Cow. Dominant share, mature category, throws off billions in cash annually.
Question Marks (Problem Children)
Question Marks are the hardest strategic decisions. They sit in high-growth markets, so there is genuine opportunity, but the company has not established a winning position yet. The question is: invest to build share, or cut losses?
The investment logic: Market growth will not last forever. If the company does not build share now, while the market is still growing, the market will eventually mature and the Question Mark becomes a Dog, stuck in low share plus low growth with no path to recovery.
Decision criteria for Question Marks:
- Does the company have a credible path to market leadership? (If not, divest.)
- What is the investment required to reach the share threshold? (If too high relative to the potential payoff, divest.)
- Is the growth sustainable, or is it a temporary spike? (Verify demand quality.)
Dogs
Dogs are the portfolio's difficult conversation. Low share plus low growth means no strategic path to value creation through the business itself.
Why companies keep Dogs: emotional attachment ("we built this business"), the sunk cost fallacy, or concern about job losses. None of these are strategic reasons.
Strategic options:
- Divest: Sell to a competitor who has higher share in the segment (for them, it might be a Cash Cow).
- Harvest: Stop investing; milk whatever cash is left while cutting costs.
- Turn around: Only if there is a credible, differentiated repositioning (extremely rare).
How units move through the matrix over time
The quadrants are not fixed. A healthy product follows a path: it usually enters as a Question Mark in a young, fast-growing market, earns its way into a Star if you win share, then settles into a Cash Cow when growth slows but you keep your lead, and finally slides toward Dog status as the category fades. The whole point of the framework is to fund that journey: Cash Cow surplus pays for the Question Mark bets that become tomorrow's Stars. When an interviewer hands you a portfolio, look for this trajectory, not just the snapshot.
Worked Example: How Do You Apply the Matrix to a Portfolio?
Case prompt: Your client is a diversified consumer electronics company with four business units. The CFO wants a recommendation on portfolio allocation for the next 3 years. Use the following data:
Step 1: Confirm the growth read. Market growth here is given, but in a live case you would compute it yourself. The formula is current-year market unit sales divided by prior-year unit sales, minus one. If the wearables market sold 12.2M units this year versus 10.0M last year, that is 12.2 / 10.0 = 1.22, or 22% growth. Apply the 10% high/low cut-off: Wearables (22%) is the only high-growth unit; the other three sit below 10% and count as low growth.
Step 2: Calculate relative market share. Divide our share by the largest competitor's share, and use 1.0x as the high/low boundary.
Two units (Smart TVs at 1.25 and Home Audio at 1.20) clear the 1.0x line on low-growth markets, so both are Cash Cows. Wearables sits far below 1.0x (0.19) in a high-growth market, the textbook Question Mark. Budget Laptops is below 1.0x (0.13) in a flat market, a clear Dog.
Step 3: Analyze each quadrant
Smart TVs (Cash Cow): Market leader in a 4% growth market. Strong cash generation. Strategy: maintain share with modest investment; extract cash to fund the Wearables decision.
Home Audio (Cash Cow): Market leader in a near-flat market. Strategy: harvest aggressively; limit reinvestment; use as a funding source.
Wearables (Question Mark): 22% market growth is exceptional, this is the market's growth phase. But we are at 0.19x of the leader's share. The critical question: can we reach 0.5x or 1.0x relative share in 3 years? If yes, invest heavily. If no, divest now while valuations are high.
Budget Laptops (Dog): Low share (0.13x), near-zero growth (1%). Classic Dog. Strategy: initiate a divestiture process. Find a buyer for whom this might be a better strategic fit.
Step 4: Recommend
Reinvest Smart TV and Home Audio cash flows ($80-100M annually) into the Wearables bet. Give the Wearables team 18 months to demonstrate a share-gain trajectory. If they reach roughly 15% market share (relative share near 0.35x) by that milestone, commit to full investment. If not, divest alongside Budget Laptops.
How this sounds in a live case
"The portfolio has two Cash Cows, one Question Mark, and one Dog. I would use Smart TVs and Home Audio as the funding base, divest Budget Laptops, and treat Wearables as a staged investment rather than an automatic bet. Before committing the full $80-100M, I would validate whether the wearables market is structurally attractive using Porter's Five Forces, whether we have the channel and product capabilities to win, and whether the investment gets us to a defensible share position before growth slows."
That last sentence is what makes the framework useful instead of academic. The quadrant tells you the direction of travel; it does not prove the answer by itself.
You have just walked the matrix end to end. The fastest way to make it stick is to apply it under interviewer pressure, on a live portfolio prompt, with feedback on your placement logic and recommendation.
Want to drill just the 2x2 reasoning first? Run a focused structure drill and get feedback on your portfolio classification before you take on the full case.
What Are the BCG Matrix Limitations You Must Acknowledge?
Interviewers expect you to know where the framework breaks down:
In a real case interview, raise one or two of these qualifications proactively, because it signals analytical maturity. "One limitation of this framework is that it does not account for cross-business synergies. Home Audio and Smart TVs might share distribution and marketing assets in a way that makes Home Audio more valuable than its standalone BCG position suggests."
How Is the BCG Matrix Used in Strategic Management?
In corporate strategy, the BCG Matrix functions as a portfolio planning tool for diversified firms allocating capital across business units. Unlike a case interview where you apply it in 20 to 30 minutes, real strategy teams use it as a recurring diagnostic (updated quarterly with market share estimates and growth projections) to surface which units deserve capital, which should be harvested, and which should be divested.
The academic convention labels the low-share, low-growth quadrant "Dogs" (also called "Pets" in some BCG documentation). The strategic logic is the same regardless of label: these units consume management attention without strategic payoff and are candidates for harvest or exit.
How corporate strategists use the matrix in practice:
The key difference between academic and case-interview application: in real strategic management, the matrix is a starting point for deeper competitive analysis (market attractiveness, capability fit, synergy mapping), not a decision by itself. A skilled consultant who presents only the 2x2 to a board will be challenged immediately. The same applies in a live case.
How Do You Apply the BCG Matrix Step by Step at the Board?
Use this sequence when you get a portfolio allocation prompt:
- List the units. Put each business unit, product line, or geography on paper as its own item.
- Define the growth signal. Mark whether each unit sits in high or low growth. State your threshold assumption explicitly (for example, "I will use 10% as my high/low boundary").
- Estimate relative share. For each unit, divide its market share by the category leader's to get a ratio, and compare against the 1.0x line. Above 1.0 you lead; below 1.0 you trail.
- Place each unit in the matrix. Pick the right quadrant for every item.
- Translate quadrants into actions. For each box, attach a concise action: invest, defend, make a staged bet, or divest.
Then add two layers that separate strong candidates: (a) call out the uncertainty around each measurement, and (b) state what evidence would change your quadrant call. A compact summary (one decision, one condition, one risk per unit) reads stronger than an elaborate narrative. The only way to make this sequence automatic is repetition, so run it on a live case until the board work feels routine.

Growth · medium
Practice a growth-strategy case end to end
Consumer Services / Fitness
What Are the Common BCG Matrix Mistakes in Case Interviews?
Forcing a portfolio frame on a non-portfolio prompt. If the case is about pricing, unit economics, or margin improvement for a single business, the BCG Matrix adds noise. Use it only when you have competing units that force ranking choices.
Confusing direction and magnitude. High growth in one segment can be short-term if the category is being disrupted. State your assumptions about growth sustainability before placing a unit.
Skipping transition logic. Saying "Star means invest" is not enough. Add conditions: what would prove the investment thesis, and what would make you cut?
Treating the matrix as final truth. One strong closing line: "This is a starting map. We should validate with customer, margin, and capability signals before execution." That sentence shows analytical maturity.
Each of these mistakes is easiest to unlearn live, so practice a portfolio case with AI feedback and let the coaching flag the moment you force the frame or skip transition logic.
Naming it in a BCG interview. Use "growth-share matrix" or "portfolio matrix." Branding it as "the BCG Matrix" inside BCG reads as memorized rather than reasoned. See the BCG case interview guide for more firm-specific etiquette, and drill the framework live with BCG case interview practice.
Connected Frameworks
The BCG Matrix works best as part of a broader growth strategy toolkit:
- Ansoff Matrix: choose which growth path to pursue before building the portfolio framework. The Ansoff vs BCG comparison shows when to reach for each.
- Porter's Five Forces: evaluate whether each business unit's industry can sustain attractive returns.
- McKinsey 7S Framework: test whether the organization has the structure, systems, and skills to shift resources.
- Profitability framework: validate whether a Cash Cow actually produces cash after customer, channel, and cost differences.
- Growth strategy cases: execution approaches once portfolio allocation is decided.
- M&A case framework: evaluate acquisitions to fill portfolio gaps.
For a broader view of how portfolio frameworks fit alongside profitability, growth, and M&A cases, see the case interview frameworks complete guide. When the case requires evaluating whether an individual unit should be exited or acquired, the PE due diligence framework provides the deal-level analysis that sits below the BCG classification. Switching industries to break into consulting? The case prep guide for career changers shows how to build framework fluency from scratch.
Sources and Further Reading (checked June 18, 2026)
- BCG, "What Is the Growth Share Matrix?": bcg.com/about/overview/our-history/growth-share-matrix
- Wikipedia, "Growth-share matrix" (origin, experience curve, limitations): en.wikipedia.org/wiki/Growth-share_matrix
- Corporate Finance Institute, "BCG Matrix Overview" (10% growth cut-off): corporatefinanceinstitute.com/resources/management/boston-consulting-group-bcg-matrix
- Marketing Study Guide, "BCG Matrix Formulas and Calculations" (relative share and growth formulas): marketingstudyguide.com/bcg-matrix-formulas-and-calculations
- Hacking the Case Interview, "BCG Matrix": hackingthecaseinterview.com/pages/bcg-matrix
- Management Consulted, "BCG Matrix": managementconsulted.com/bcg-matrix
FAQ
Frequently asked questions
Keep reading
- Ansoff Matrix Case Interview: The 2x2 Growth Framework Explained with ExamplesFrameworks · Mar 25, 2026
- Airline Case Interview: Profitability Framework, Revenue Drivers, and Worked Examples (2026)Frameworks · Mar 29, 2026
- Energy Case Interview: Oil & Gas Framework, Worked Example, and Prep Guide (2026)Frameworks · Mar 31, 2026
- ESG Case Interview: Dual-Metric Framework, Scope Emissions, and Worked Example (2026)Frameworks · Mar 31, 2026